
Figure 7. High throughput analysis of D-water labeled human leukocytes.
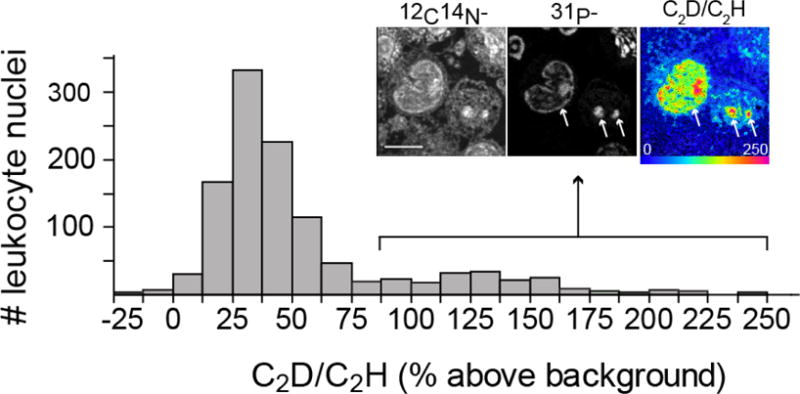
The data shown in the bar graph are from a mosaic made of 74 tiles, individual field sizes = 40 μm × 40 μm, 7 minutes per tile. 1107 cells analyzed. Inset: 17 μm × 17 μm field image from a representative highly labeled leukocyte, 150 planes, 65 s/plane. Scale bar = 5 μm.