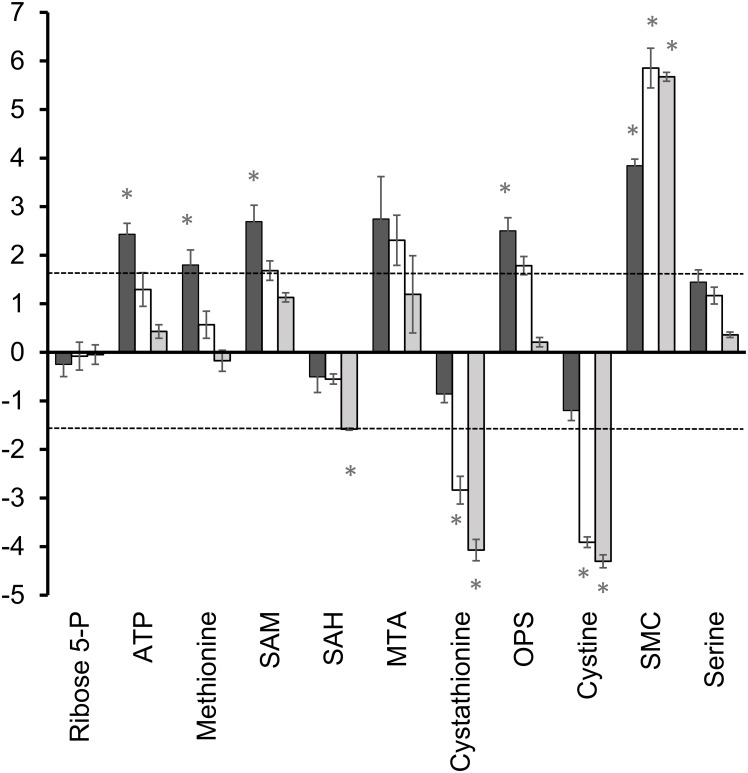
Fig 5. Comparison of total levels of intermediates in nucleotide and methionine metabolism from extracts of 13C labelled cells.
Total metabolite levels represent the sum of the peak intensities of all isotopologues of metabolites detected in extracts of 13C labelled cells. Graphs show the log2 fold change in total peak intensities after 2, 6 and 20 h growth. Results represent the mean of 3 independent cultures ± SD. Dashed line indicates the threshold for a definite difference between the species (3-fold or log2 1.6-fold change in metabolite level). Positive values represent a relative increase in T. vaginalis, negative values a relative decrease. Ribose-5P, Ribose-5-phosphate; SAM, S-adenosylmethionine; SAH, S-adenosylhomocysteine; MTA, 5-methylthioadenosine; OPS, O-phosphoserine; SMC, S-methylcysteine. * P ≤ 0.001 (Paired T-Test, assuming equal variance).

