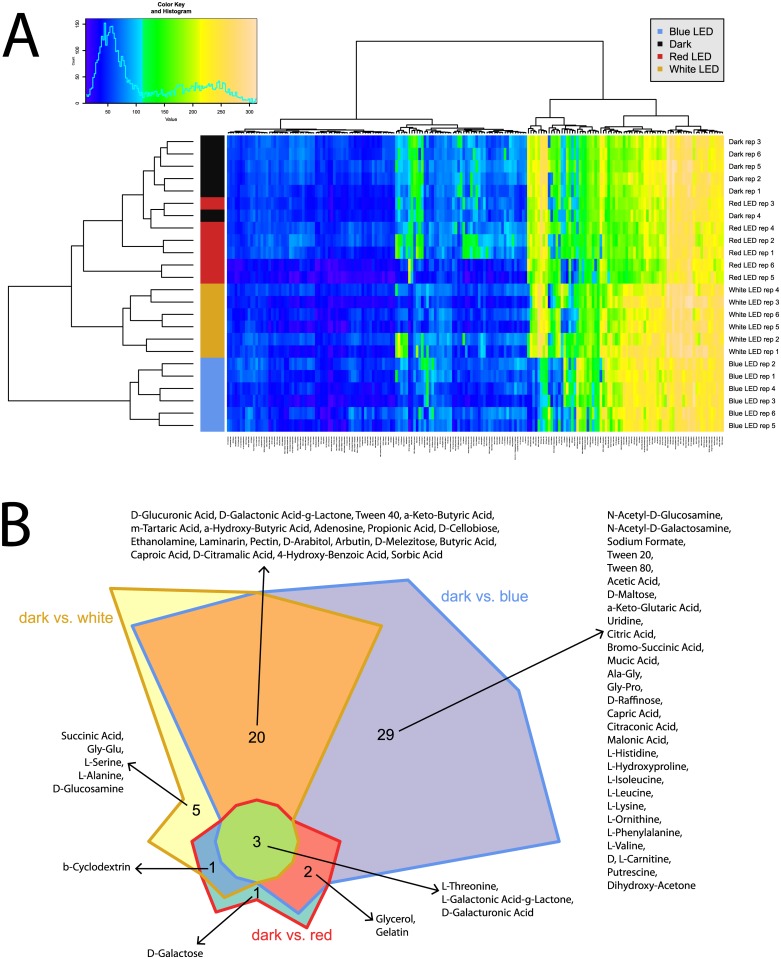
Fig 3. Overview of respiration behavior of Pseudomonas sp. DR 5–09 on 190 carbon (C) sources tested.
(A) Heatmap of maximum height values of 190 C sources when exposed to blue, red, and white LEDs or darkness, expressed as maximum curve height monitored during 96 h of incubation. The legend (upper corner to the left) explains the color code from blue to green, while yellow shades indicate low, moderate, and high utilization of C sources, assessed as arbitrary Omnilog values. The histogram describes the frequency of maximum height reached for C sources. (B) Chow Rusky diagram of sole C utilization patterns in which respiration of Pseudomonas sp. DR 5–09 was affected (significantly different to dark incubation) by exposure to blue, red, and white LEDs.

