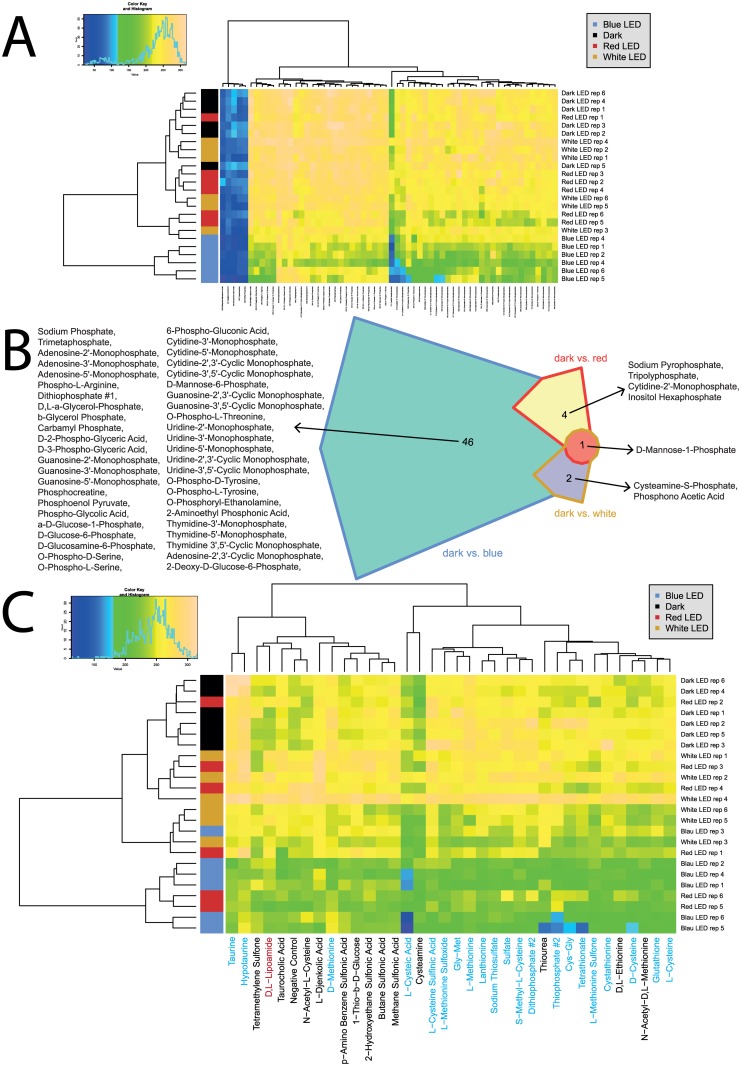
Fig 5. Overview of respiration behavior of Pseudomonas sp. DR 5–09 on 59 phosphorous (P) sources and 35 sulfur (S) sources tested.
(A) Heatmap of utilization of 59 phosphorus (P) sources by Pseudomonas sp. DR 5–09 when exposed to blue, red, and white LEDs or darkness, expressed as maximum curve height monitored during 96 h of incubation. The legend (upper corner to the left) explains the color code from blue to green, while yellow shades indicate low, moderate, and high utilization of P sources, assessed as extinction (Omnilog values). The histogram describes the frequency of utilization of different P sources. (B) Chow Rusky diagram of P substrate utilization patterns by Pseudomonas sp. DR 5–09 incubated in darkness compared with incubation under blue, red, or white LEDs (significantly different from dark incubation). (C) Heatmap of utilization of 35 sulfur (S) sources by Pseudomonas sp. DR 5–09 when exposed to blue, red, and white LEDs or darkness, expressed as maximum curve height monitored during 96 h of incubation. Substrate names in blue and red denote substrates significantly affected by blue and red light treatment, respectively.

