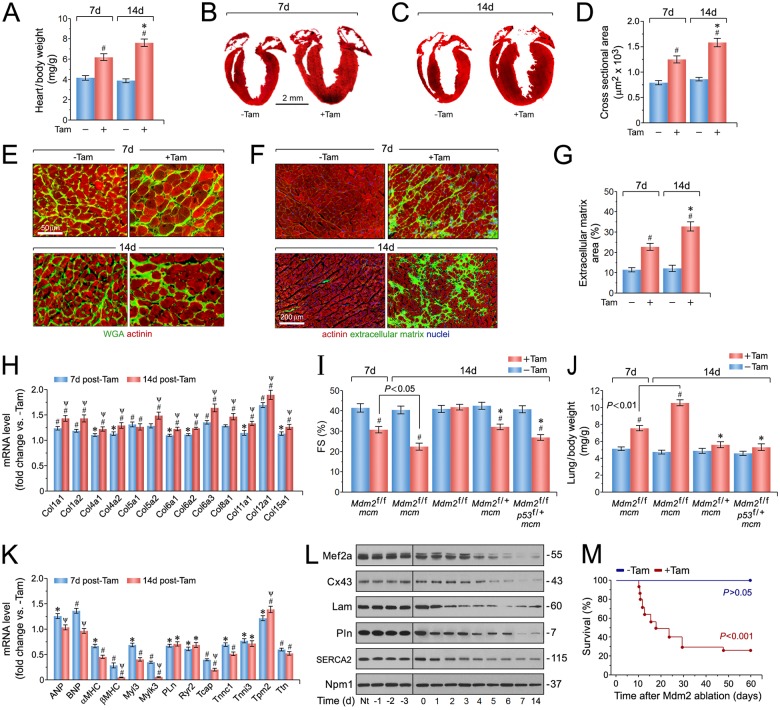
Fig 3. Ablation of Mdm2 is associated with the development of concentric hypertrophy and cardiac dysfunction.
(A) Heart-weight corrected for body weight in Mdm2f/f;mcm mice at 7d and 14 days post-Tam. n = 24. #P < 0.01 vs. -Tam. *P < 0.01 vs. Mdm2f/f;mcm at 7 days post-Tam. (B) Masson staining of longitudinal cardiac sections of Mdm2f/f;mcm mice at 7 days post-Tam. (C) Masson staining of longitudinal cardiac sections of Mdm2f/f;mcm mice at 14 days post-Tam. (D) Quantification of cross-sectional area of adult cardiomyocytes in Mdm2f/f;mcm mice shown in Fig 2E. n = 6–8. #P < 0.01 vs. -Tam. *P < 0.05 vs. Mdm2f/f;mcm at 7 days post-Tam. (E) Immunofluorescence microscopy of wheat germ agglutinin (WGA, green; top panel) and cardiomyocyte-specific anti-actinin (red; bottom panel) stained left ventricular sections from Mdm2f/f;mcm mice. (F) Immunofluorescence microscopy employing WGA staining (green) of the extracellular matrix, cardiomyocyte-specific anti-actinin (red), and Dapi (blue) to visualize nuclear DNA in left ventricular sections from Mdm2f/f;mcm mice. (G) Quantification of extracellular matrix area indicative of left ventricular fibrosis in Mdm2f/f;mcm mice shown in Fig 2F. n = 4. #P < 0.01 vs. -Tam. *P < 0.05 vs. Mdm2f/f;mcm at 7 days post-Tam. (H) Transcript levels of differentially expressed collagen types in Tam-treated Mdm2f/f;mcm mice as determined by RT-qPCR at 7 days and 14 days post-Tam. n = 4. #P < 0.01 vs. -Tam. *P < 0.05 vs. -Tam. ΨP < 0.05 vs. 7d +Tam. (I) Fractional shortening (FS) determined by M-mode echocardiography of the indicated strains at 7 and 14 days post-treatment with Tam or vehicle. n = 6. #P < 0.01 vs. -Tam. *P < 0.05 vs. Mdm2f/f;mcm at 14 days post-Tam. (J) Lung/body weight ratios in various Mdm2/p53 mutant mice at 7 and 14 days after Tam treatment. n = 6. #P < 0.01 vs. -Tam. *P < 0.05 vs. Mdm2f/f;mcm at 14 days post-Tam. (K) Levels of hypertrophic marker genes in Mdm2f/f;mcm mice as analyzed by qRT-PCR at 7 days and 14 days post-Tam. n = 4. #P < 0.01 vs. -Tam. *P < 0.05 vs. -Tam. ΨP < 0.05 vs. 7d +Tam. (L) Immunoblot analysis of cardiac-specific gene expression in left ventricular samples from Mdm2f/f;mcm mice. Nt, no treatment. Western blots were repeated at least once with similar results. (M) Acute genetic ablation of Mdm2 evokes premature death. Kaplan-Meier survival curves of conditional Mdm2f/f;mcm mice. n = 20. Fig 3A to Fig 3M: 12-week-old mice (7 days post-Tam) and 13-week-old mice (14 days post-Tam) were analyzed. Fig 3 data are means±s.e.m.

