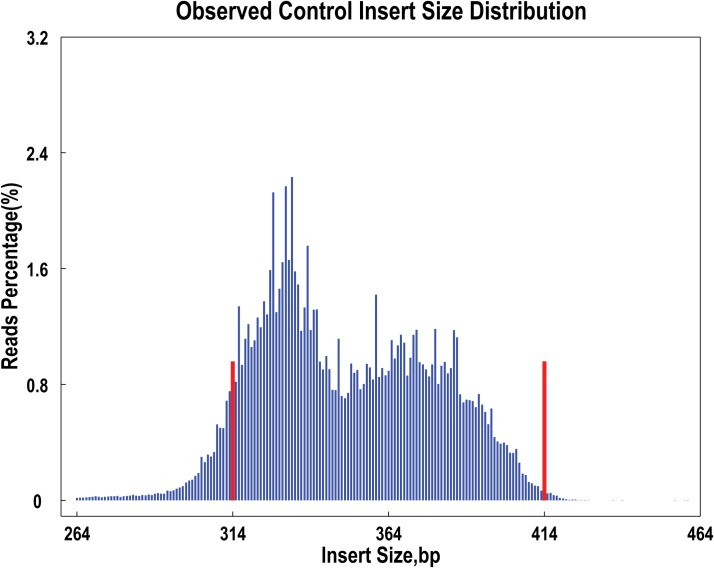
Fig 1. The observed insert size distribution.
Note: X-axis represents the size of the insert reads; Y-axis represents the percentage of insert reads of each size. The expected size of SLAFs fall within the interval range between the two red lines. It can be seen in the figure that size of the most sequence reads were between 314-414bp.

