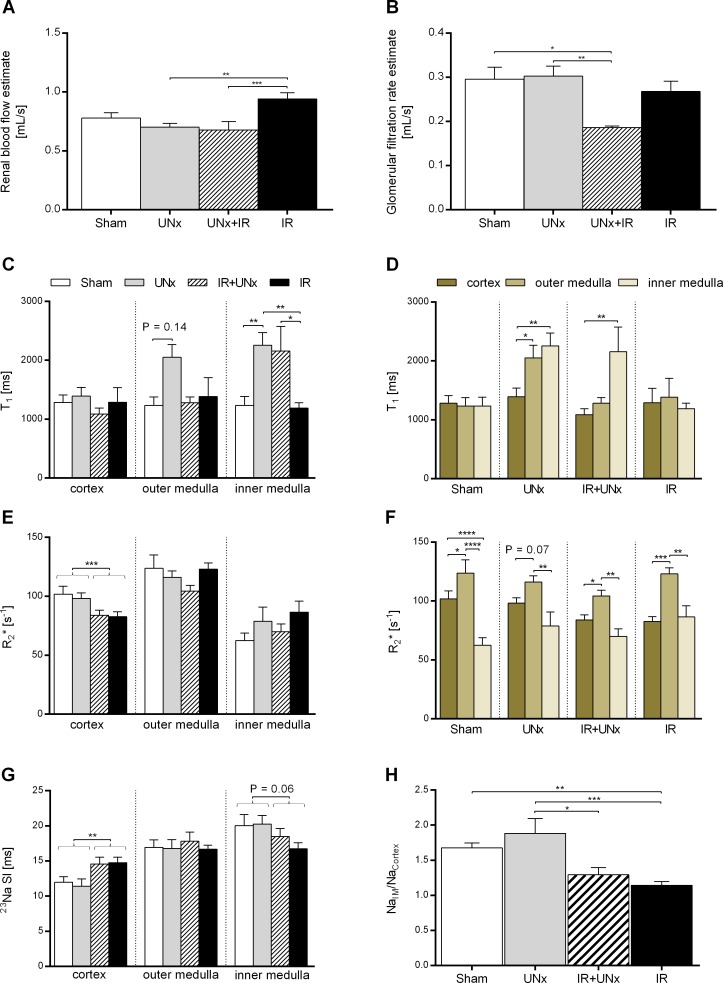
Fig 2. MRI experiments.
A: Estimates of renal blood flow and B: glomerular filtration rate at 24 hours both adjusted for kidney size. The parameters are based on dynamic contrast enhanced magnetic resonance imaging (DCE-MRI) and analysis using the Patlak-Rutland plot. Intrarenal T1, R2* and 23Na values presented D+F: groupwise and C+E+G: from the different regions of the kidney: the cortex, outer medulla and inner medulla. H: The ratio between sodium signal intensity in inner medulla normalized to cortex, representing the cortico-medullary sodium signal gradient. All values are expressed as mean ± SEM. The effect of UNx and IRI were evaluated by two-way analysis of variance (ANOVA). Group means were compared using two-way ANOVA followed by Bonferroni’s multiple comparisons post-test or the Kruskal-Wallis test with Dunn’s post-test. Means within a group were compared using paired one-way ANOVA or Friedman’s test.* P < 0.05, ** P < 0.01, *** P < 0.005 and **** P < 0.0001. Number of animals: Sham (DCE, n = 7; T1, n = 6; BOLD + 23Na, n = 8), UNx (DCE, n = 7; T1 + BOLD + 23Na, n = 8), IR (n = 8) and IR+UNx (DCE-MRI, n = 5; T1 + BOLD + 23Na, n = 6). IR, ischemia-reperfusion; UNx, unilateral nephrectomy.

