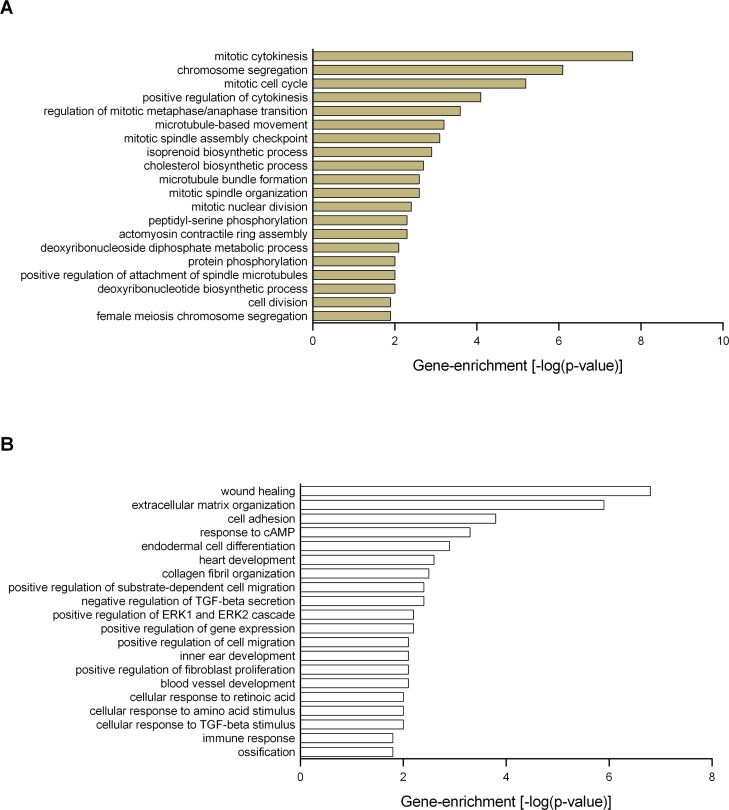
Fig 3. Functional enrichment analysis.
The Significance Analysis of Microarrays (SAM) identified A: 56 up-regulated genes (without IRI) and B: 47 down-regulated genes (with IRI) in response to UNx. Functional enrichment analysis was performed using these gene sets in DAVID Bioinformatics Resources, and the enriched Gene Ontology annotations (the biological processes) are presented. The following criteria defined the threshold of an enriched category: a modified Fischer Exact p-value of < 0.05 (> 1.3 after -log10 transformation), and n ≥ 2 genes represented in a category. Number of animals, n = 3 in each group.

