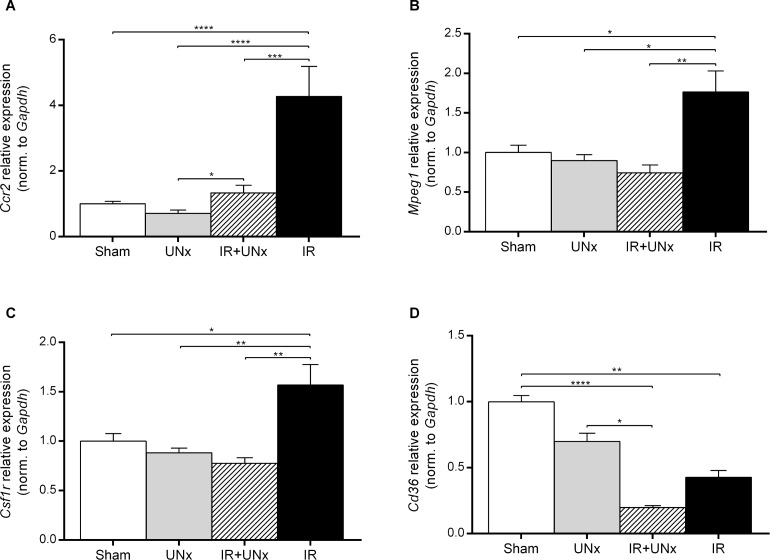
Fig 6. Validation of macrophage expressed genes.
A: Ccr2, C-C chemokine receptor type 2. B: Mpeg1, macrophage expressed 1. C: Csf1r, colony stimulating factor 1 receptor. D: Cd36, cd36 molecule. Bars represent mRNA levels by quantitative polymerase chain reaction in the left renal cortex and outer medulla normalised to Gapdh mRNA. All values are expressed as mean ± SEM. Group means were compared using two-way ANOVA followed by Bonferroni’s multiple comparison post-test. * P < 0.05, ** P < 0.01, *** P < 0.005 and **** P < 0.0001. Number of animals: sham, UNx and IR groups (n = 8), IR+UNx (n = 6). IR, ischemia-reperfusion; UNx, unilateral nephrectomy.

