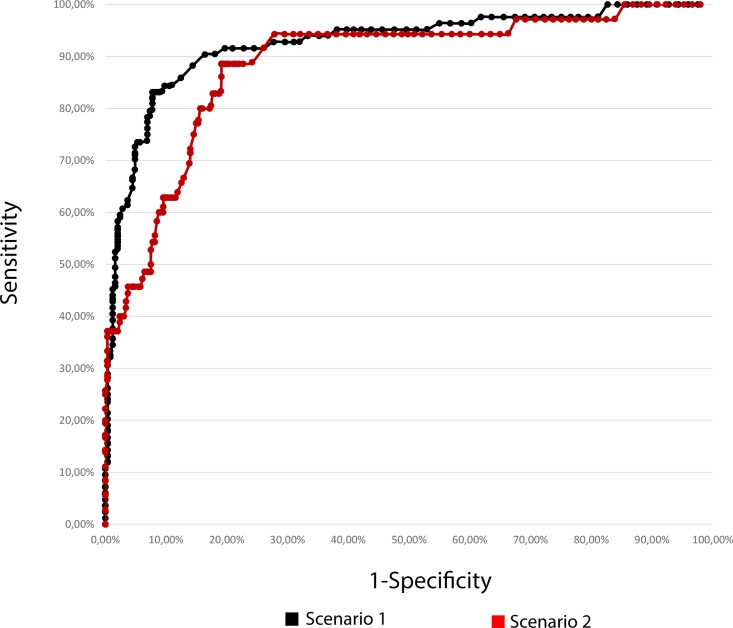
Fig 2. ROC curves for scenarios 1 and 2.
Receiver operating characteristics curves (n = 328) for the HfCHL test. Scenario 1 (in black): Target group for the test (disease group) included all patients with incomplete ossicular discontinuity. Scenario 2 (in red): Target group for the test (disease group) exclusively included patients with type 2 IOD.

