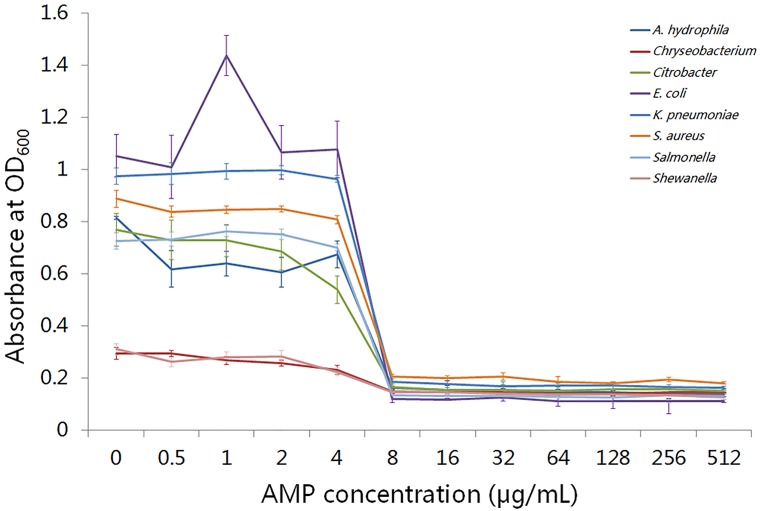
Fig 4. Minimum inhibitory concentration (MIC) assay of liver-expressed antimicrobial peptide 2.
The x-axis represents concentration of liver-expressed antimicrobial peptide 2; the left y-axis represents absorbance values of bacteria cultures at OD600. The lines with different colors represent different bacteria.

