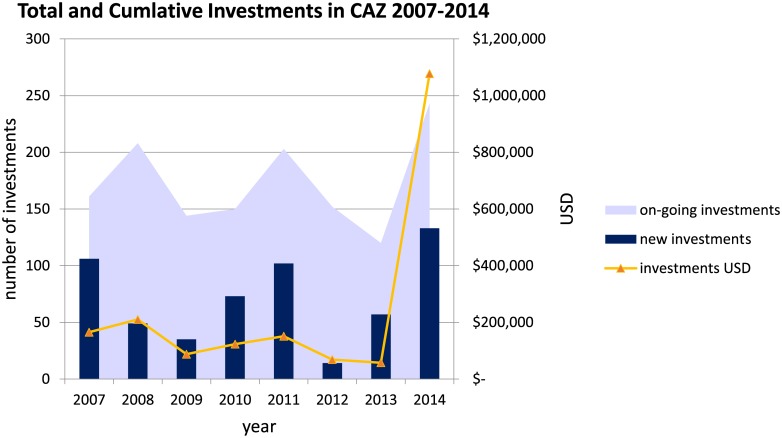
Fig 4. Total and cumulative Investments in CAZ 2007–2014.
The number of investments between 2007–2014 in CAZ starting in each year are shown with the blue bars along with the total USD invested each year shown with orange triangle markers (USD values on the secondary y-axis). The total number of cumulative investments in any given year is shown in light blue.

