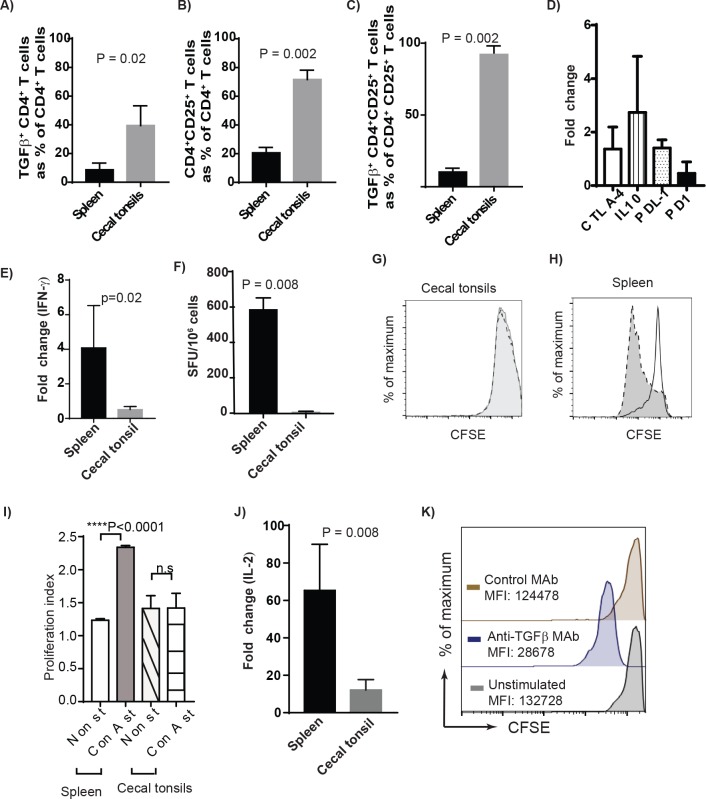
Fig 2. High concentrations of Treg cells in cecal tonsils is associated with immune-privileged microenvironment.
Mononuclear cells were isolated from spleens or cecal tonsils of six 3-weeks old RIR birds and were stained with anti-CD4-PE, CD25-FITC, and TGF-beta-APC or isotype controls. 7AAD was used for dead cell exclusion, and the cells were analysed using FACS. Percentages of (A) TGF-beta+CD4+ T cells (B), CD4+CD25+ T cells (C) TGF-beta+CD4+CD25+ T cells in the spleens and cecal tonsils are shown. (D) Relative quantification of the CTLA-4, IL-10, PDL1 and PD1 molecules in cecal tonsils over spleen mononuclear cells. Fold change was calculated in non-stimulated cecal tonsils considering normalized Ct value for respective molecule from spleen as baseline. (E) Relative quantification of fold change in IFN-γ gene in cecal tonsils and spleens after 4 h of stimulation with PMA/Ionomycin were determined using RT-PCR. (F) The frequencies of IFN-γ producing cells in cecal tonsils and spleens were determined using chicken-IFN-gamma ELISPOT assay 18 hrs after PMA/Ionomycin stimulation. (G) CFSE histograms from one representative of T cell proliferation in cecal tonsils and (H) in splenocytes are shown following stimulation with 2.5 μg/ml Con-A. Empty profiles with solid line represent non-stimulated control cells and the grey shaded area represents Con A-stimulated cells. (I) Graphical representation of proliferation index in Con-A stimulated and non-stimulated mononuclear cells from spleens and cecal tonsils of seven birds are shown. (J) Relative quantification of the IL-2 cytokine gene in PMA/Ionomycin stimulated cecal tonsils and spleen mononuclear cells. The fold change in mRNA for IL-2 cytokine in stimulated cells was calculated over non-stimulated cells after normalizing against housekeeping gene. (K) anti-TGF-beta blocking antibody partially restored the proliferation of mononuclear cells isolated from CT using CFSE-based proliferation assay. Data are shown as means with standard deviations (error bars) of at least of three independent experiments. ns, not significant.

