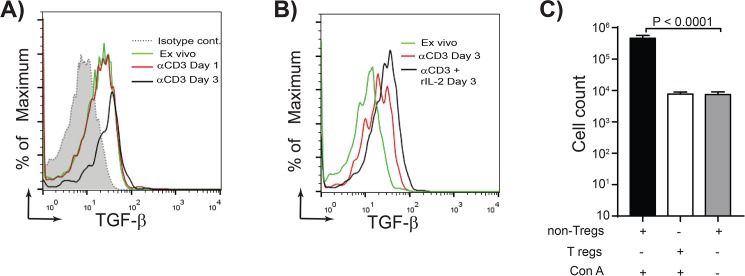
Fig 3. Induction of TGF-beta+CD4+ T cells in vitro.
(A) Representative of overlapping histogram demonstrating the expression levels of TGF-beta on gated CD4+ T cells isolated from 3-weeks old RIR chickens. Ex vivo CD4+ T cells (green line), CD4+ T cells stimulated with anti-CD3 mAb for 24 hours (red line), and 72 hrs (black line) are shown. Dotted line represents cells stained with isotype control antibody, (B) Compares the expression levels of TGF-beta on CD4+ T cells ex vivo (green line), or cells stimulated with anti-CD3 and rIL-2 (black line), and cells stimulated with only anti-CD3 mAb (red line) at 72 hours after stimulation. (C) The numbers of live cells (7AAD negative) are shown after co-cultured of the responder cells with non-Treg cells (TGF-beta- Treg cells) (black bar) or Treg cells (TGF-beta+CD4+ T cells) (open bar) 72hrs after stimulation with Con-A. Grey bar represents the numbers of live cells in co-culture of the responder cells and TGF-beta-CD4+ T cells without stimulation. A representative of three independent experiments is shown.

