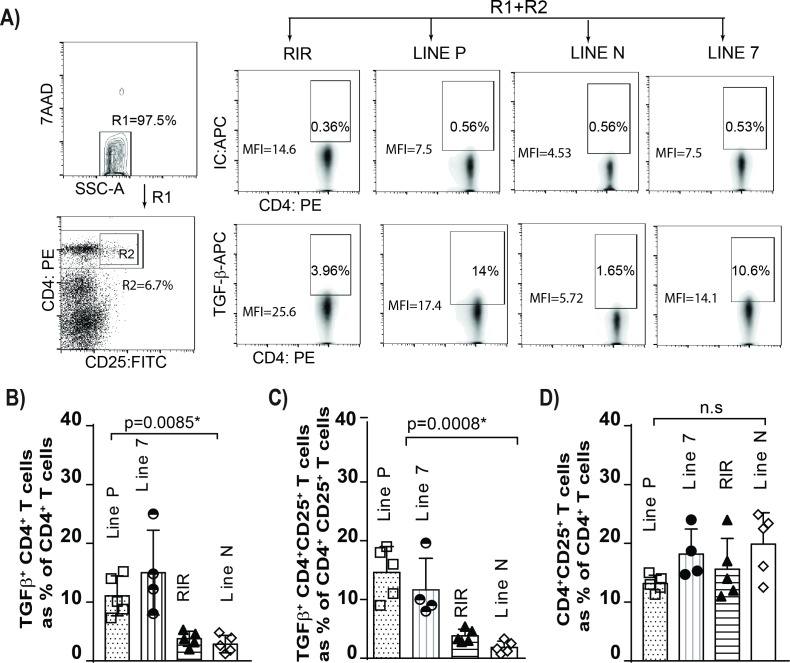
Fig 4. High concentrations of TGF-beta+CD4+ T cells in susceptible birds to virus-induced lymphoma.
A) Gating strategy for detection of TGF-beta+ Treg cells are shown. Mononuclear cells were isolated from spleens of 3 weeks-old naïve chicken lines, and were surface stained with anti-CD4-PE, anti-CD25-FITC and anti-TGF-beta-APC mAbs or isotype controls. The 7AAD staining was used for dead cell exclusion. The percentages and mean fluorescent intensity (MFI) of CD4+ cells expressing TGF-beta are shown in FACS density plots. The percentages of (B) TGF-beta+CD4+ T cells, (C) TGF-beta+CD4+CD25+ T cells and (D) CD4+CD25+ T cells in different chicken lines are shown. The values are representative from five different birds for each group. The mean ± SD value are shown. * indicates a statistically significant difference (P < 0.05); ns, not significant.

