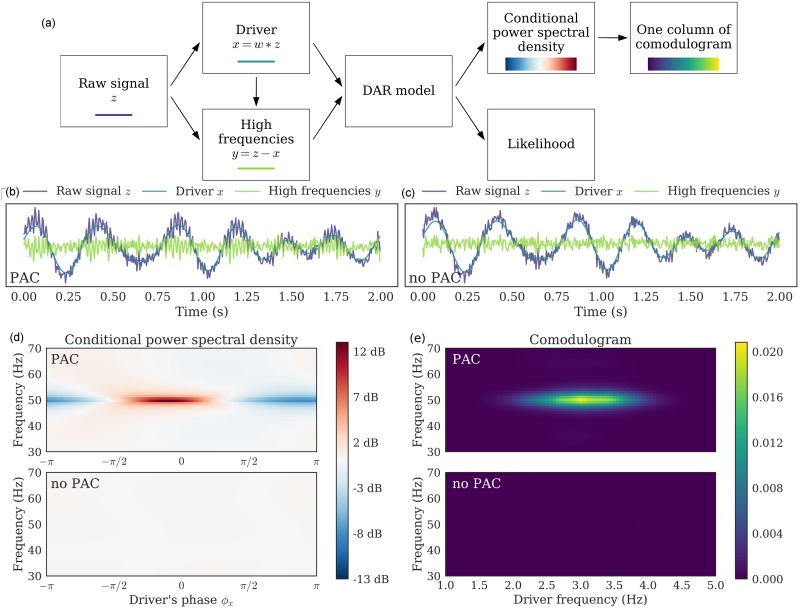
Fig 2. Example on simulated signals: Pipeline, signal, conditional PSD, and comodulogram.
(a) Pipeline of the method. We applied it with (p, m) = (10, 1) on two simulated signals: (b) Simulated signal with PAC and (c) Simulated signal without PAC. (d) From a fitted model, we computed the PSD conditionally to the driver’s phase ϕx; each line is centered independently to show amplitude modulation. PAC can be identified in the fluctuation of the PSD as the driver’s phase varies: around 50 Hz, the PSD has more power for one phase than for another. This figure corresponds to a single driver’s frequency fx = 3.0 Hz. (e) Applying this method to a range of driver’s frequency, we build a comodulogram, which quantifies the PAC between each pair of frequencies.

