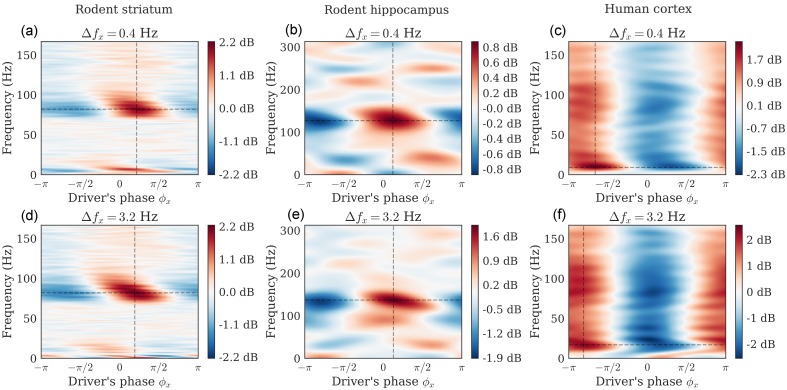
Fig 6. PSD conditional to the driver’s phase.
Dataset: Rodent striatum (a,d), rodent hippocampus (b,e), human auditory cortex (c,f). We derive the conditional PSD from the fitted DAR models. In one plot, each line shows at a given frequency the amplitude modulation with respect to the driver’s phase. The driver bandwidth Δfx is 0.4 Hz (top row) and 3.2 Hz (bottom row). Note that the maximum amplitude is not always at a phase of 0 or π (i.e. respectively the peaks or the troughs of the slow oscillation). In figure (d), we can also observe that the peak frequency is slightly modulated by the phase of the driver (phase-frequency coupling).

