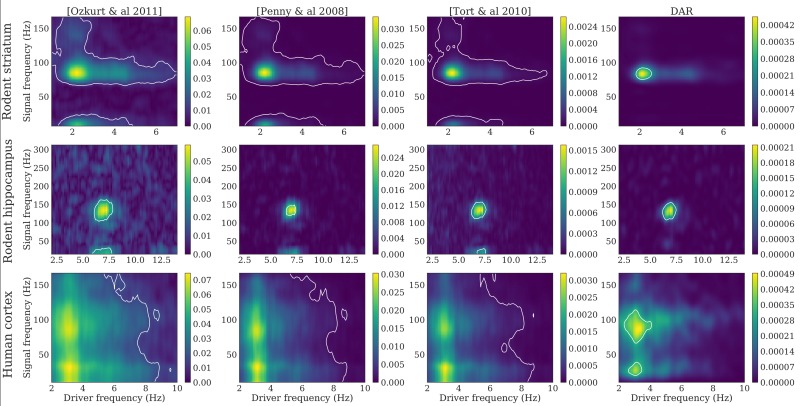
Fig 8. Comodulograms with parameters optimizing the comodulgoram sharpness.
Dataset: rodent striatum (top), rodent hippocampus (middle) and human auditory cortex (down). Methods, from left to right: [Ozkurt et al. 2011] [26], [Penny et al. 2008] [22], [Tort et al. 2010] [23], DAR models (our). The driver bandwidth is chosen to have a well defined maximum in driver frequency: Δfx = 0.4 Hz. The DAR model parameters are chosen to give similar results than the other methods: (p, m) = (10, 2). White lines outline the regions with p < 0.01.

