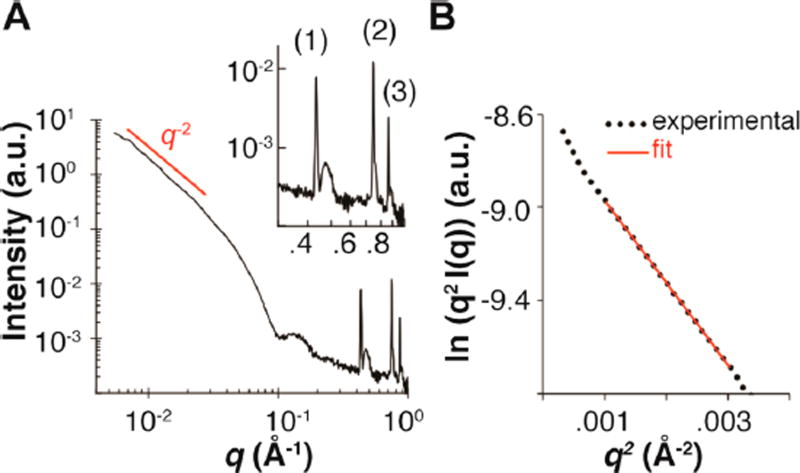
Figure 5.
(A) Small-angle X-ray scattering (SAXS) curve for a solution of 3FD-IL (10 mg/mL) in TAPS buffer (10 mM, pH 8.5). Inset: expansion of the high q region depicting the positions of the three diffraction peaks. Peaks (d-spacing): (1), 14.6 Å; (2), 8.4 Å; (3), 7.3 Å. (B) Modified Guinier plot, ln(q2 I(q)) versus q2, of scattering data for 3FD-IL using an equation for sheet-like forms: , where It,0 is a constant, and thickness (T) can be calculated as .

