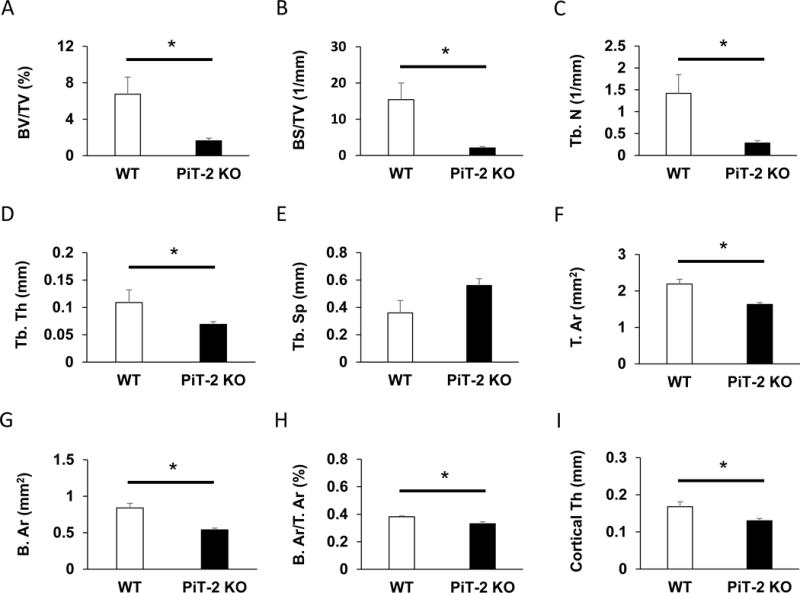
Fig. 4. Loss of PiT-2 impacts static bone morphometric parameters of femurs in male mice.

(A) BS/TV. (B) BV/TV. (C) Tb. Th. (D) Tb. N. (E) Tb. Sp. (F) T. Ar. (G) B. Ar. (H) B. Ar/T. Ar. (l) Cortical Th. Data are expressed as mean ± S.E.M. (n=3 or 5) and compared by un-paired t-test. A two-tailed P<0.05 was considered statically significant. *P<0.05 versus WT group. Ar, area; B, bone; BMD, bone mineral density; BS, bone surface; BV, bone volume; micro CT, micro-computed tomography; N, number; PiT-2 KO, PiT-2 homozygous knockout; Sp, separation; T, total; Tb, trabecular; Th, thickness; TV, total volume; WT, wild-type.
