Figure 5. The synergistic effect of LAST and CNBP on mRNA expression.
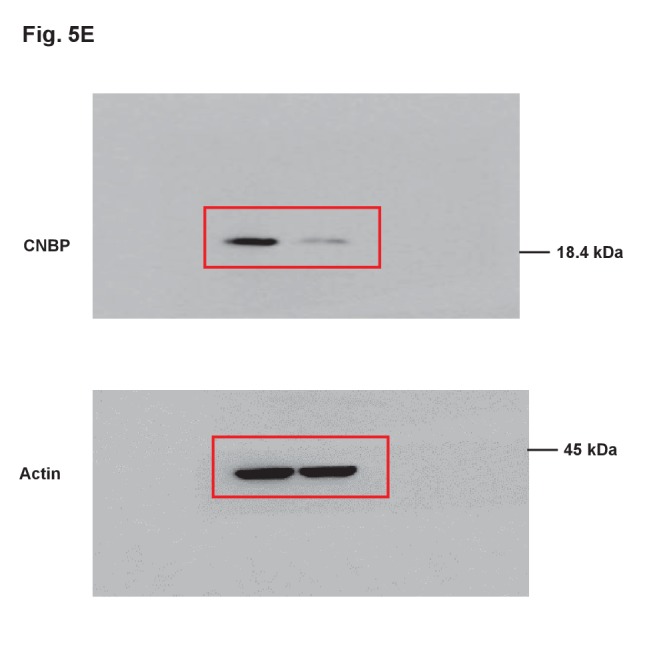
(A) Venn diagram represents 225 overlapping transcripts (Supplementary file 2) obtained from LAST RNA-seq (red) and CNBP RIP-seq (violet). (B) Heatmap showing that SOX9, NFE2L1, PDF and CCND1 are not only decreased upon LAST knockdown but also enriched by CNBP. (C) HCT116 cells expressing control shRNA or LAST shRNA-1 were treated with actinomycin D (1 μg/mL) for the indicated periods of time. Total RNAs were extracted and then analyzed by real-time RT-PCR to examine the mRNA half-life of SOX9, NFE2L1 and PDF. Data shown are the mean ± SD (n = 6; *p<0.05, **p<0.01, ***p<0.001, two-tailed t-test). (D) HCT116 cells expressing control RNA or LAST were treated with actinomycin D (1 μg/mL) for the indicated periods of time. Total RNAs were extracted and then analyzed by real-time RT-PCR to examine the mRNA half-life of SOX9, NFE2L1 and PDF. (E) HCT116 cells were infected with lentiviruses expressing control shRNA or CNBP shRNA. Ninety-six hours later, cell lysates were subjected to western blotting to detect the CNBP knockdown efficiency. (F) HCT116 cells were infected with lentiviruses expressing control shRNA or CNBP shRNA. Ninety-six hours after injection, total RNA was analyzed by real-time RT-PCR with the indicated primers. Data shown are the mean ± SD (n = 3; ***p<0.001, two-tailed t-test).

Figure 5—figure supplement 1. Uncropped images of blots.