. 2017 Dec 4;6:e30433. doi: 10.7554/eLife.30433

Figure 6. LAST promotes tumorigenesis.

(A) A total of 3 × 106 HCT116 cells expressing either control shRNA or LAST shRNA-1 were individually injected subcutaneously into the flanks of nude mice (n = 7 for each group) as indicated. Representative photographs of xenograft tumors in situ were taken 6 weeks after injection. (B) Tumors of the above nude mice (Figure 6A) were also selected to be weighed. Data shown are the mean ± SD (n = 7; ***p<0.001, two-tailed t-test). (C) A total of 3 × 106 HCT116 cells expressing either control RNA or LAST were individually injected subcutaneously into the flanks of nude mice (n = 7 for each group) as indicated. Representative photographs of xenograft tumors in situ were taken 3 weeks after injection. (D) Tumors of the above nude mice (Figure 6C) were selected and weighed. Data shown are the mean ± SD (n = 7; ***p<0.001, two-tailed t-test). (E) Data for the LAST and CCND1 expression levels in COAD (colon adenocarcinoma) tumor and normal tissues were downloaded from the TCGA dataset. Box plots showing differential expression of LAST and CCND1 between normal (n = 41) and tumor (n = 454) samples. Statistical analysis was performed using the two-tailed t-test (***p<0.001). (F) Data for LAST and CCND1 expression levels in READ (rectum adenocarcinoma) tumor and normal tissues were downloaded from the TCGA dataset. Box plots showing the differential expression of LAST and CCND1 between normal (n = 10) and tumor (n = 165) samples. Statistical analysis was performed using the two-tailed t-test (***p<0.001). (G) Pathway analysis of differentially downregulated genes (log2 (fold change) below - 0.58 in RNA-seq) in HCT116 with and without LAST knockdown. The top 10 significant pathways with enrichment scores are shown. (H) A schematic illustration of the proposed model depicting the role of c-Myc-induced LAST in regulating CCND1 mRNA stability via CNBP. (I) Gene homology analysis of LAST in human, chimp, gorilla, rhesus, mouse, rabbit, dog, chicken and zebrafish.

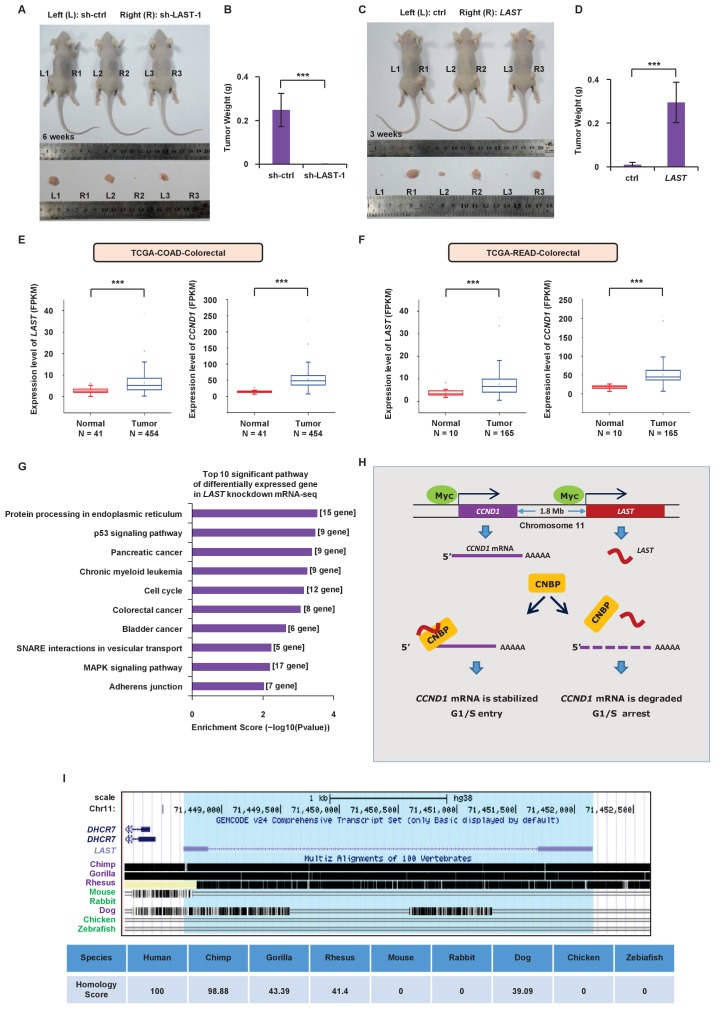
Figure 6—source data 1. Source data for Figure 6B, D, E and F.
DOI: 10.7554/eLife.30433.026

Figure 6.

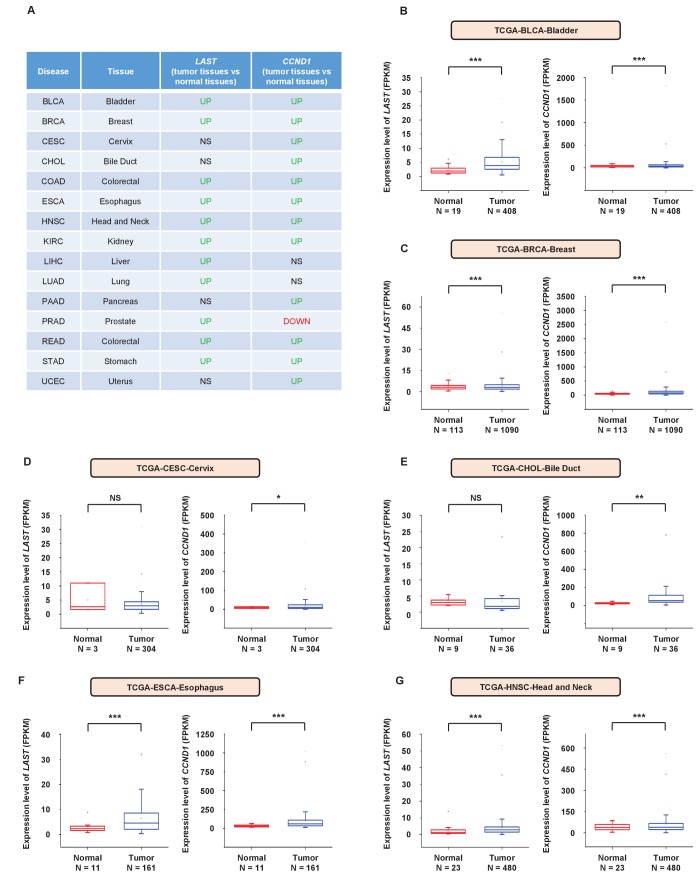
Figure 6—figure supplement 1. The expression levels of LAST and CCND1 are both higher in most tumor tissues than in their normal counterparts.

Figure 6—figure supplement 1.

(A) Summary table of the differential expression of LAST and CCND1 between 15 tumor tissue types and their corresponding normal tissues. Data were from the TCGA dataset. (B) Data for the LAST and CCND1 expression levels in BLCA (bladder urothelial carcinoma) tumor and normal tissues were downloaded from the TCGA dataset. Box plots showing differential expression of LAST and CCND1 between normal (n = 19) and tumor (n = 408) samples. Statistical analysis was performed using the two-tailed t-test (***p<0.001). (C) Data for the LAST and CCND1 expression levels in BRCA (breast invasive carcinoma) tumor and normal tissues were downloaded from the TCGA dataset. Box plots showing differential expression of LAST and CCND1 between normal (n = 113) and tumor (n = 1090) samples. Statistical analysis was performed using the two-tailed t-test (***p<0.001). (D) Data for the LAST and CCND1 expression levels in CESC (cervical squamous cell carcinoma) tumor and normal tissues were downloaded from the TCGA dataset. Box plots showing the differential expression of LAST and CCND1 between normal (n = 3) and tumor (n = 304) samples. Statistical analysis was performed using the two-tailed t-test (*p<0.05). (E) Data for the LAST and CCND1 expression levels in CHOL (cholangiocarcinoma) tumor and normal tissues were downloaded from the TCGA dataset. Box plots showing the differential expression of LAST and CCND1 between normal (n = 9) and tumor (n = 36) samples. Statistical analysis was performed using the two-tailed t-test (**p<0.01). (F) Data for the LAST and CCND1 expression levels in ESCA (esophageal carcinoma) tumor and normal tissues were downloaded from the TCGA dataset. Box plots showing the differential expression of LAST and CCND1 between normal (n = 11) and tumor (n = 161) samples. Statistical analysis was performed using the two-tailed t-test (***p<0.001). (G) Data for the LAST and CCND1 expression levels in HNSC (head and neck squamous carcinoma) tumor and normal tissues were downloaded from the TCGA dataset. Box plots showing the differential expression of LAST and CCND1 between normal (n = 23) and tumor (n = 480) samples. Statistical analysis was performed using the two-tailed t-test (***p<0.001).
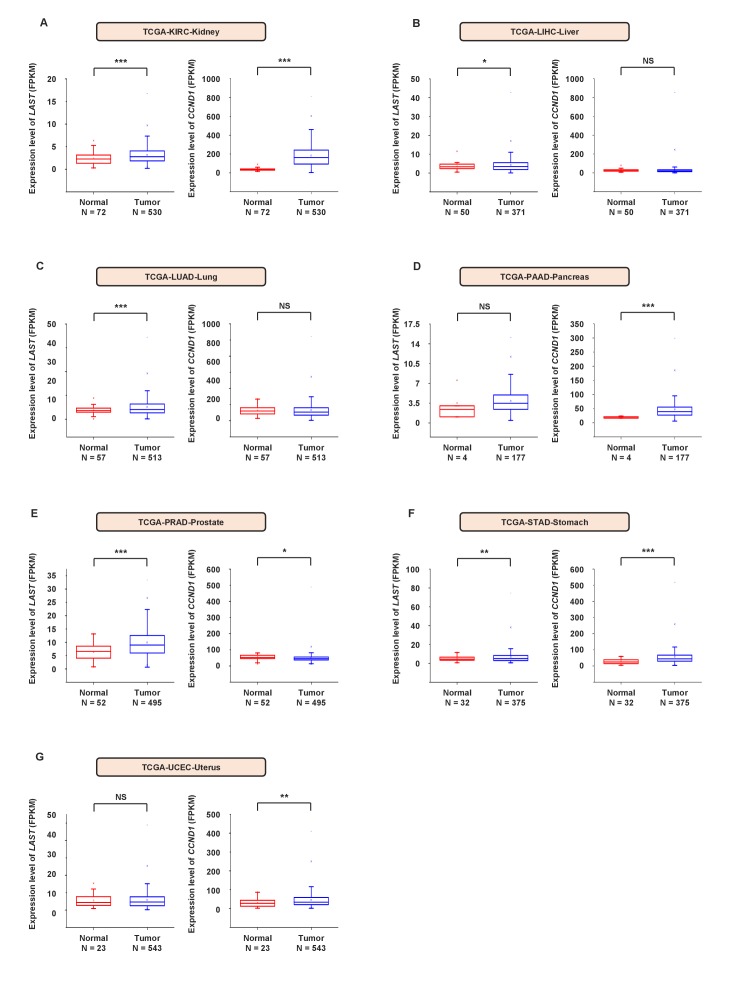
Figure 6—figure supplement 2. The expression levels of LAST and CCND1 are both higher in most tumor tissues than in their normal counterparts.

Figure 6—figure supplement 2.

(A) Data for the LAST and CCND1 expression levels in KIRC (kidney renal clear cell carcinoma) tumor and normal tissues were downloaded from the TCGA dataset. Box plots showing the differential expression of LAST and CCND1 between normal (n = 72) and tumor (n = 530) samples. Statistical analysis was performed using the two-tailed t-test (***p<0.001). (B) Data for the LAST and CCND1 expression levels in LIHC (liver hepatocellular carcinoma) tumor and normal tissues were downloaded from the TCGA dataset. Box plots showing the differential expression of LAST and CCND1 between normal (n = 50) and tumor (n = 371) samples. Statistical analysis was performed using the two-tailed t-test (*p<0.05). (C) Data for the LAST and CCND1 expression levels in LUAD (lung adenocarcinoma) tumor and normal tissues were downloaded from the TCGA dataset. Box plots showing the differential expression of LAST and CCND1 between normal (n = 57) and tumor (n = 513) samples. Statistical analysis was performed by the two-tailed t-test (***p<0.001). (D) Data for the LAST and CCND1 expression levels in PAAD (pancreatic adenocarcinoma) tumor and normal tissues were downloaded from the TCGA dataset. Box plots showing the differential expression of LAST and CCND1 between normal (n = 4) and tumor (n = 177) samples. Statistical analysis was performed using the two-tailed t-test (***p<0.001). (E) Data for the LAST and CCND1 expression levels in PRAD (prostate adenocarcinoma) tumor and normal tissues were downloaded from the TCGA dataset. Box plots showing the differential expression of LAST and CCND1 between normal (n = 52) and tumor (n = 495) samples. Statistical analysis was performed using the two-tailed t-test (*p<0.05, ***p<0.001). (F) Data for the LAST and CCND1 expression levels in STAD (stomach adenocarcinoma) tumor and normal tissues were downloaded from the TCGA dataset. Box plots showing the differential expression of LAST and CCND1 between normal (n = 32) and tumor (n = 375) samples. Statistical analysis was performed using the two-tailed t-test (**p<0.01, ***p<0.001). (G) Data for the LAST and CCND1 expression levels in UCEC (uterine corpus endometrial carcinoma) tumor and normal tissues were downloaded from the TCGA dataset. Box plots showing the differential expression of LAST and CCND1 between normal (n = 23) and tumor (n = 543) samples. Statistical analysis was performed using the two-tailed t-test (**p<0.01).