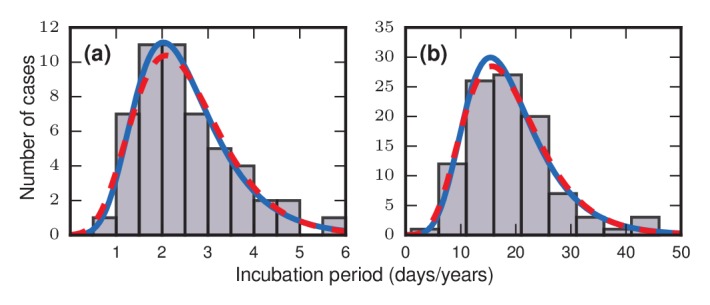
Figure 1. Frequency distributions of incubation periods for two diseases.

Data redrawn from historic examples. Dashed red curves are noncentral lognormal distributions. Solid blue curves are Gumbel distributions, predicted by the theory developed here. Both sets of curves were fitted via the method of moments. (a) Data from an outbreak of food-borne streptococcal sore throat, reported in 1950 (Sartwell, 1950). Time is measured in units of days. (b) Data from a 1949 study of bladder tumors among workers following occupational exposure to a carcinogen in a dye plant (Goldblatt, 1949). Time is measured in units of years.
