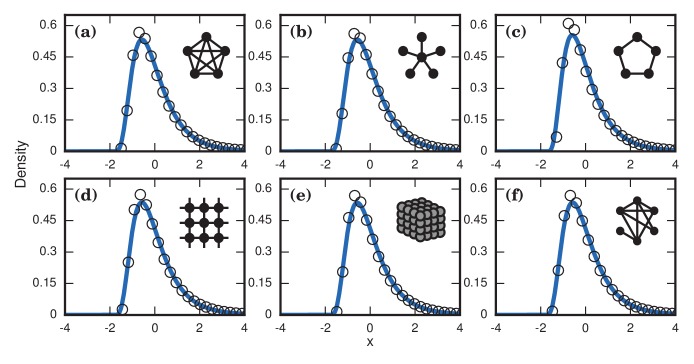
Figure 8. Neutrally fit invader .
Simulated and fitted distributions of invader fixation times are shown for Birth-death dynamics on various networks. All distributions were normalized to have mean zero and unit variance. The curves indicate noncentral lognormals fitted via the method of moments. (a) Complete graph on nodes, for runs. (b) Star graph with spokes, for runs. (c) One-dimensional ring on nodes, for runs. (d) Two-dimensional lattice on nodes, for runs. (e) Three-dimensional lattice on nodes for runs. (f) Erdős-Rényi random graph on nodes with an edge probability of .

