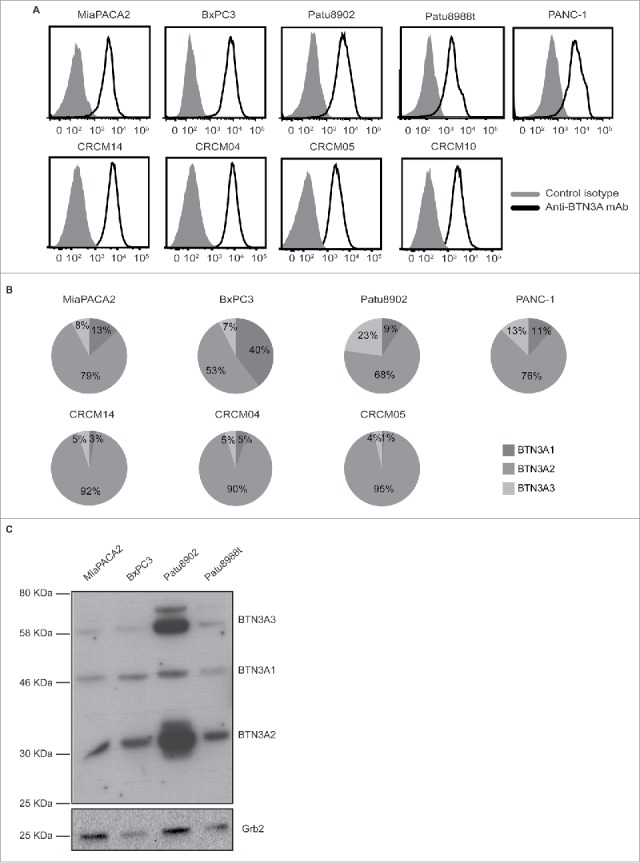
Figure 2.

BTN3A isoform expression in pancreatic cell lines. (A) Representative overlays of BTN3A global surface expression (black line) compared to isotype control (grey line) in pancreatic cell lines (n = 5) as assessed by flow cytometry (upper panel) and in PDX-derived cell lines (n = 4) using an anti-BTN3A mAb (lower panel). (B) Transcriptional expression of BTN3A isoforms. Representative expression of the three BTN3A isoforms in pancreatic- (upper panel) and PDX-derived cell lines (lower panel). qRT PCR analyses were performed on total RNA isolated from pancreatic cell lines. Data were normalized using Peptidylpropyl isomerase A (PPIA) as an endogenous control (ΔCt = CtTarget gene – CtPPIA). Results were expressed as mean 2−ΔCt and shown as percentage of total quantified BTN3A isoforms. (C) BTN3A protein expression. Western Blot analysis of total protein extracts of pancreatic cell lines. Extracts were loaded in 10% SDS PAGE gel and membranes were hybridized with anti-BTN3A 20.1 mAb and anti-Grb2 as a loading control.
