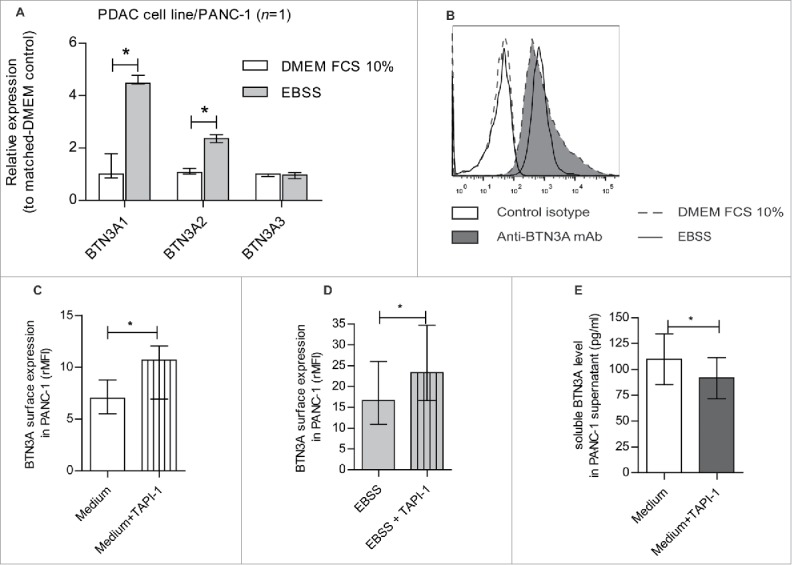
Figure 4.

Nutrient starvation-induced regulation of BTN3A isoforms, BTN3A surface expression and release under soluble form. (A) Transcriptional analysis by qRT PCR of the 3 BTN3A isoforms expression in PANC-1 cell line under nutrient starvation. Data were normalized using Peptidylprolyl isomerase A (PPIA) as an endogenous control; (ΔCt = Ct target gene –Ct PPIA) and fold change (2−ΔΔCt) was established using the expression of the matched BTN3A isoform in the DMEM FCS 10% condition as a calibrator gene. Results were expressed as median 2−ΔΔCt ± interquartile range and statistical significance was established using Mann Whitney U Test. *p < 0.05. Cumulative data from 2 independent experiments performed in duplicate. (B) BTN3A surface expression under nutrient starvation. Flow cytometry analysis of BTN3A surface expression in PANC-1 cell line and PDAC-PDX CRCM 04, cultured with DMEM FCS 10% (medium, dashed line) or EBSS (nutrient starvation, full line). Control isotype (open histogram) and anti-BTN3A mAb (filled histogram) are depicted. Representative data from 2 independent experiments. (C, D) Effect of MMP inhibitor TAPI-1 on BTN3A surface expression. Flow cytometry analysis of BTN3A expression in PANC-1 cell line treated or not with TAPI-1 (20 µM), under DMEM 10% FCS culture (C) and 24 hours-nutrient starvation (D). Cumulative data from 3 independent experiments. Results are expressed as median of Median Fluorescence Intensity Ratio (rMFI) ± interquartile range and statistical significance was established using paired t-test. *p < 0.05. (E) Effect of MMP inhibitor TAPI-1 on BTN3A release as a soluble form. ELISA analysis of BTN3A in PANC-1 supernatants treated or not with TAPI-1 (20 µM). Concentrations are expressed in pg/ml. Cumulative data of 2 independent experiments performed in duplicate. Statistical significance was established using paired t-test. *p < 0.05.
