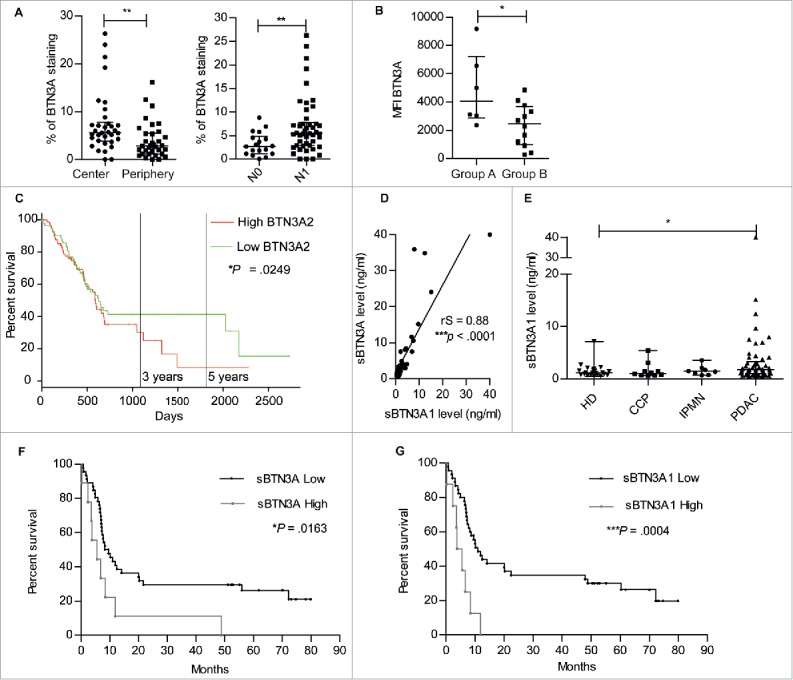
Figure 6.

Surface BTN3A expression, BTN3A2 gene expression and soluble BTN3A levels are prognosis marker in patients with Pancreatic Ductal AdenoCarcinoma (PDAC). (A) The median percentage of BTN3A staining was higher in the center than in the periphery of the PDAC Tissue Multi Array (n = 34) (left panel). The median percentage of BTN3A staining was higher in the group of pancreatic tumors with lymph node involvement (N1) compared with the group devoid of lymph node involvement (N0) (n = 32) (right panel). Results were expressed as median percentages ± range. Paired-t test was used to compare differences between the center and the periphery of the tumor and Mann Whitney U test between N0 and N1 groups. 0.001 <**p < 0.01. (B) BTN3A surface expression assessed in PDX-derived cell lines classified in 2 groups: A/short-term survival group (overall survival (OS) ≤ 8 months; n = 6) and B/ long-term survival group (OS > 8 months; n = 12). Surface expression was quantified by Median Fluorescence Intensity minus matched control isotype (MFI). Results are shown as median ± range. (C) Comparative overall survival in patient with respect to BTN3A2 gene expression. The cohort was divided at median of BTN3A2 expression: BTN3A2 Low (n = 85) and BTN3A2 High (n = 85). Data were obtained from TCGA public database. *p <0.05. (D) Correlation between sBTN3A concentrations assessed with “pan-BTN3A” ELISA or “BTN3A1-specific” ELISA in the plasma of PDAC patients' plasmas (n = 45). Data are shown in ng/ml. The correlation was established using the nonparametric Spearman correlation coefficient (rs). ***p < 0.001. (E) Comparative dosage of sBTN3A1 concentration in Healthy Donors (HD) (n = 22), patients with Chronic Calcific Pancreatitis (CCP) (n = 10), Intraductal Papillary Mucinous Neoplasm (IPMN) (n = 8) and PDAC (n = 54). sBTN3A1 levels were assessed by ELISA in the plasma of subjects. Data were expressed in ng/ml, and median concentration of sBTN3A1 ± interquartile range. Significance was established using non-parametric Mann Whitney Test. *p < 0.05. (F, G) Comparative survival in PDAC patients according to (F) sBTN3A (n = 55) and (G) sBTN3A1 dosage (n = 53). Kaplan-Meier curves showing overall survival: (F) in patients with Low sBTN3A (< 8 ng/ml) or High sBTN3A levels (< 8 ng/ml) and (G) in patients with Low sBTN3A1 levels (< 6 ng/ml) or High sBTN3A1 levels (>6 ng/ml). Statistical significance was established with Log-rank (Mantel-Cox) Test. *p <0.05; ***p < 0.0005.
