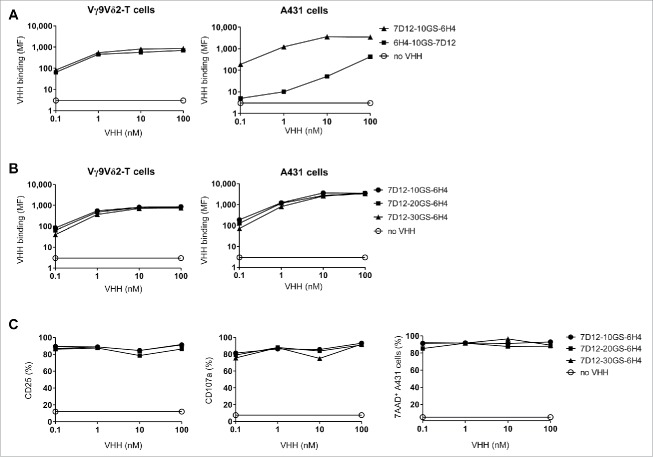
Figure 2.
The effect of orientation and linker length in the bispecific VHH. (A and B) Vγ9Vδ2-T cells (left) or EGFR-expressing A431 cells (right) were incubated in the presence or absence of the indicated VHHs and bound VHH was assessed by flow cytometry. Mean fluorescence intensity (MF) of bound VHH to the cells is depicted. (C) Vγ9Vδ2-T cells and A431 cells were co-cultured in a 1:1 ratio for 24 hrs in the presence or absence of the indicated bispecific VHH. Both CD25 (left) and CD107a (middle) expression on Vγ9Vδ2-T cells were assessed by flow cytometry. The percentage of lysed A431 cells (right) was determined using 7-AAD staining and flow cytometry. Representative figures of n = 3 experiments are shown. Abbreviations: Gly4Ser (GS).

