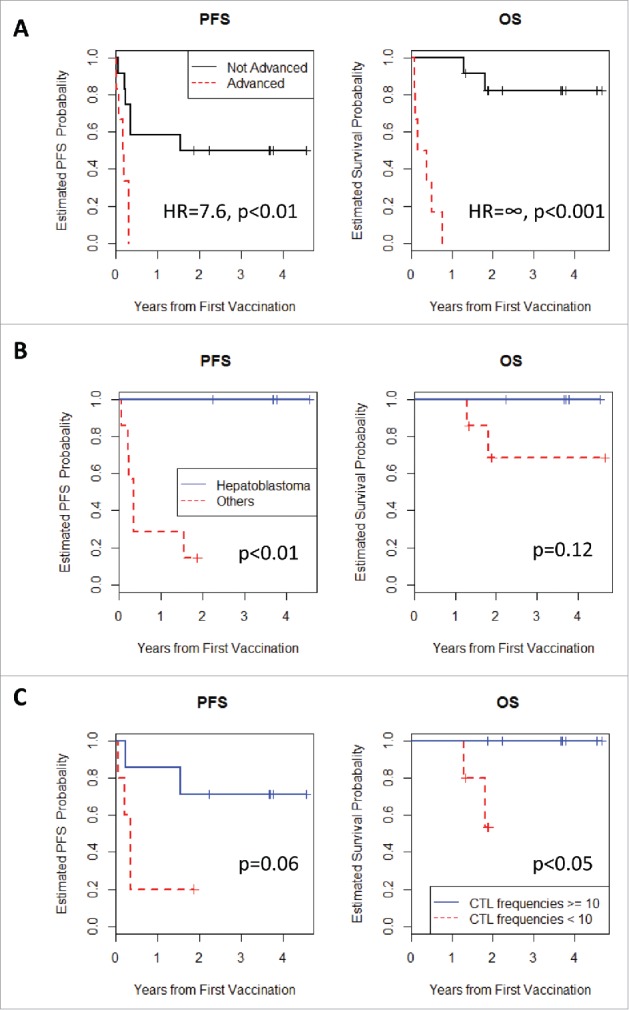
Figure 1.

(A) Kaplan-Meier curves for PFS and OS. Patients in the partial-remission and remission groups (not advanced) exhibited longer PFS and OS than those in the progression group (advanced) (p < 0.01 and p < 0.001, respectively). (B) Kaplan-Meier curves for PFS and OS. Hepatoblastoma patients in the partial-remission group exhibited longer PFS and OS than those harboring other pediatric solid tumors. (C) Kaplan-Meier curves for PFS and OS. Patients with GPC3-specfic CTL frequencies ≥10 exhibited longer PFS and OS than those with GPC3-specfic CTL frequencies <10 (p = 0.06 and p < 0.05, respectively).
