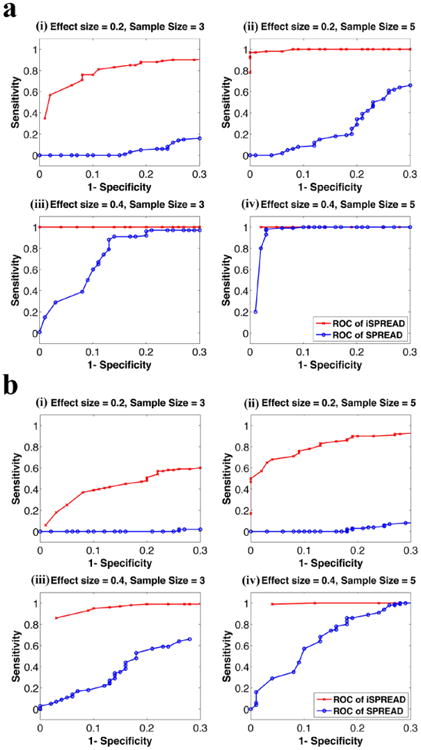
Figure 2.

ROC analyses for the two-group comparisons using iSPREAD (red crosses) and SPREAD (blue dots) from Monte Carlo simulated data under different combinations of effect size (es = 0.2, 0.4) and sample size (n = 3, 5) of each group. The disease area was simulated as either a 5 × 5 × 3 cubic region (figure 2(a)) or a 3 × 10 × 3 cuboid region (figure 2(b)). Sensitivity and Specificity were calculated using equation (9). Results for FA analysis are shown here as an example. The nonlinear anisotropic diffusion filtering was used for data smoothing in the iSPREAD method and a Gaussian kernel of fixed FWHM = 2 × 2 × 2 voxels were applied for estimation of spatial regression for SPREAD.
