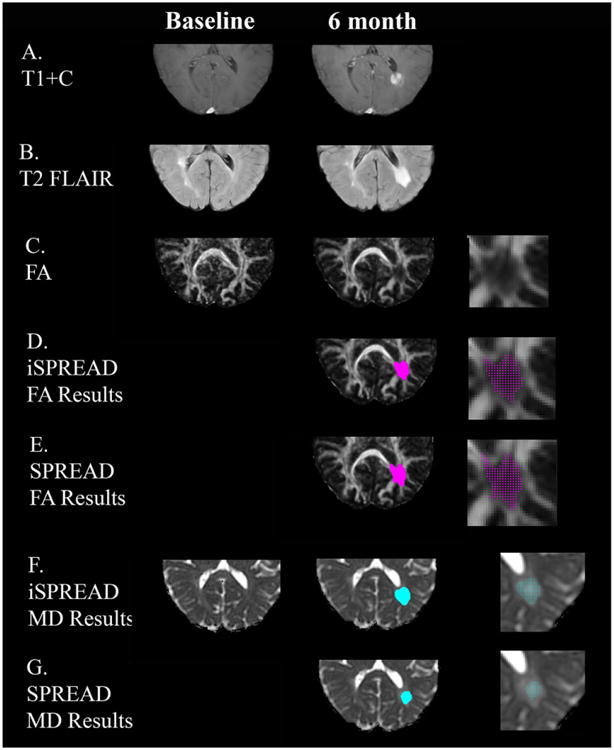
Figure 4.

Comparison of significant voxels detected for FA (marked by magenta dots) and MD (marked by cyan dots) using SPREAD (Row E and G) and iSPREAD (Row D and F) analysis of longitudinal data in monitoring disease progression for patient 1. This patient had an active lesion around the atrium of the left lateral ventricle visible on the post contrast T1 images at 6 month (Row A) after baseline, which shows as hyperintensity on FLAIR image (Row B). The images are magnified in the disease area showing the detected significant voxels on the right column.
