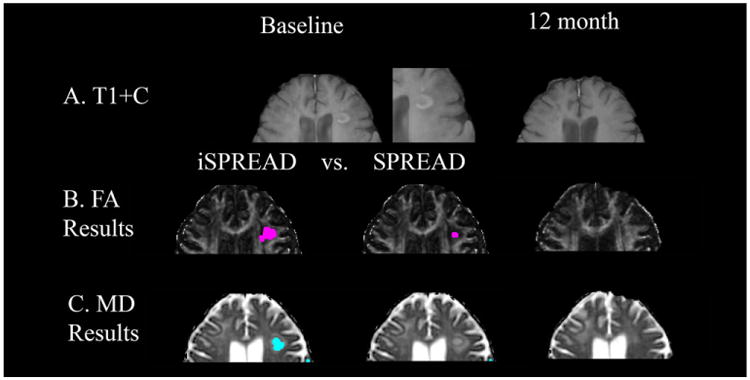
Figure 6.

Comparison of significant voxels detected for FA (marked by magenta dots) and MD (marked by cyan dots) using iSPREAD (Row B & C. First column) and SPREAD (Row B & C. Second column) analysis of longitudinal data in monitoring disease progression for patient 3. This patient had a lesion shown as a ring-enhancing lesion on T1-weighted post contrast image at baseline (Row A).
