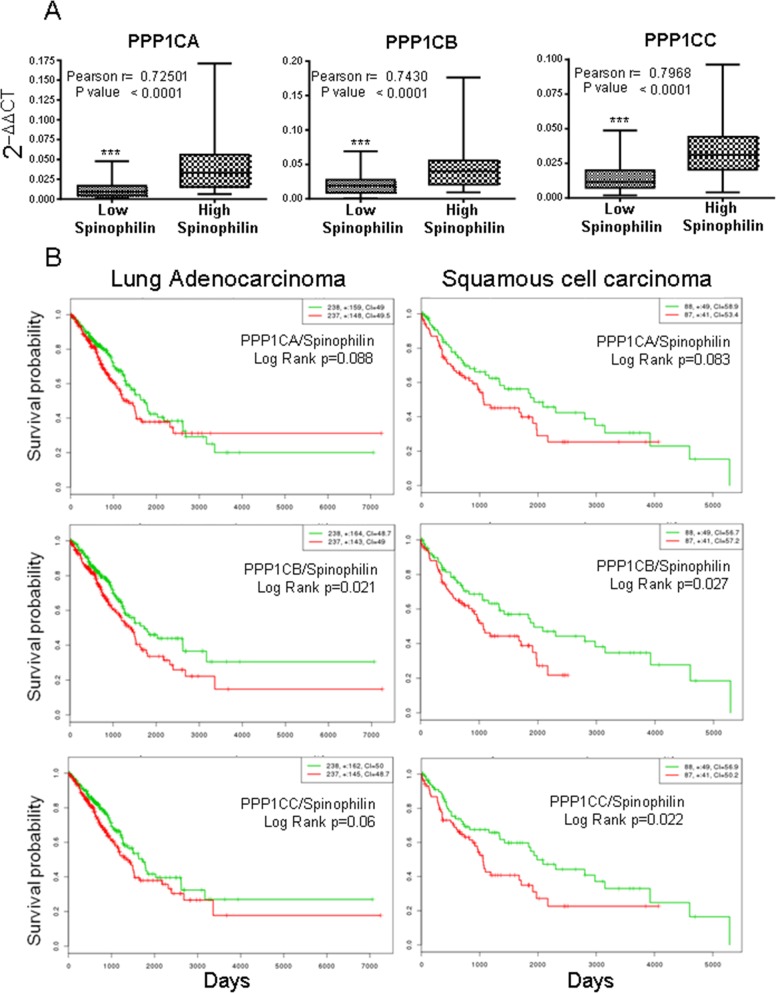
Figure 4. Survival probability of patients with lung cancer according to the joint mRNA levels of the individual catalytic subunits of PP1 and Spinophilin.
(A) Correlation between the mRNA levels of Spinophilin and the catalytic subunits of PP1 (Student's T-test; ***=p<0.001). We analyzed the levels in a cohort of 70 samples from our cohort from Supplementary Table 1, for which we had mRNA (see Materials and Methods). We quantitated by Q-RT-PCR the levels of PPP1CA, PPP1CB and PPP1CC and plotted according to the low or high levels of Spinophilin mRNA (graph). The graph shows the distribution of the PP1 catalytic subunit according to the categorization of samples in high or low Spinophilin according to its average. Furthermore we plotted one to one correlation of PPP1CA/B/C mRNA levels to Sphinophilin mRNA levels in each sample. The index of correlation (r) and statistical significance (p) for the Pearson correlation is included in the inset in each graph. (B) Survival probability (log rank) of patients with lung cancer according to the mRNA levels of the joint individual catalytic subunits of PP1 and Spinophilin. Values were taken above or below the average for each subunit evaluated. High or low risks were taken according to the values of Figure 3A. The TCGA cohort was used.

