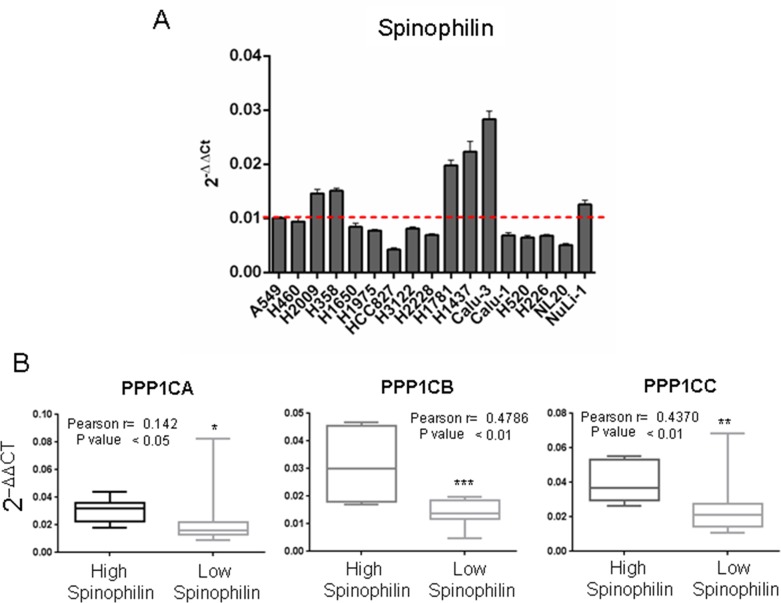
Figure 7. Correlation between the mRNA levels of Spinophilin and the catalytic subunits of PP1 in a panel of tumor cell lines.
We analyzed a cohort of 17 cell lines described in Supplementary Table 7. (A) We analyzed the expression levels of Spinophilin in the cohort of 17 cell lines described in Supplementary Table 3. We divided the panel into high and low Spinophilin, considering high Spinophilin those cell lines with expression > 0.01: H1437, H1781, H2009, H358, Calu3 and Nuli1 cell lines; and low Spinophilin the ones with expression < 0.01: H1650, H1975, H2228, H226, H3122, H460, H520, HCC827, Calu1, A549 and NL20 cell lines. (B) We detected a direct relationship between the levels of Spinophilin and the levels of each catalytic subunit. The graph shows the distribution of the PP1 catalytic subunit according to the categorization of samples with high or low Spinophilin according to its average. We considered high Spinophilin: H1431, H1781, H2009, H358, Calu3 and Nuli1 cell lines, and low Spinophilin: H1650, H1975, H2228, H226, H3122, H460, H520, H827, Calu1, A549 and NL20 cell lines. Furthermore, the inset shows Pearson's r and its statistical significance.

