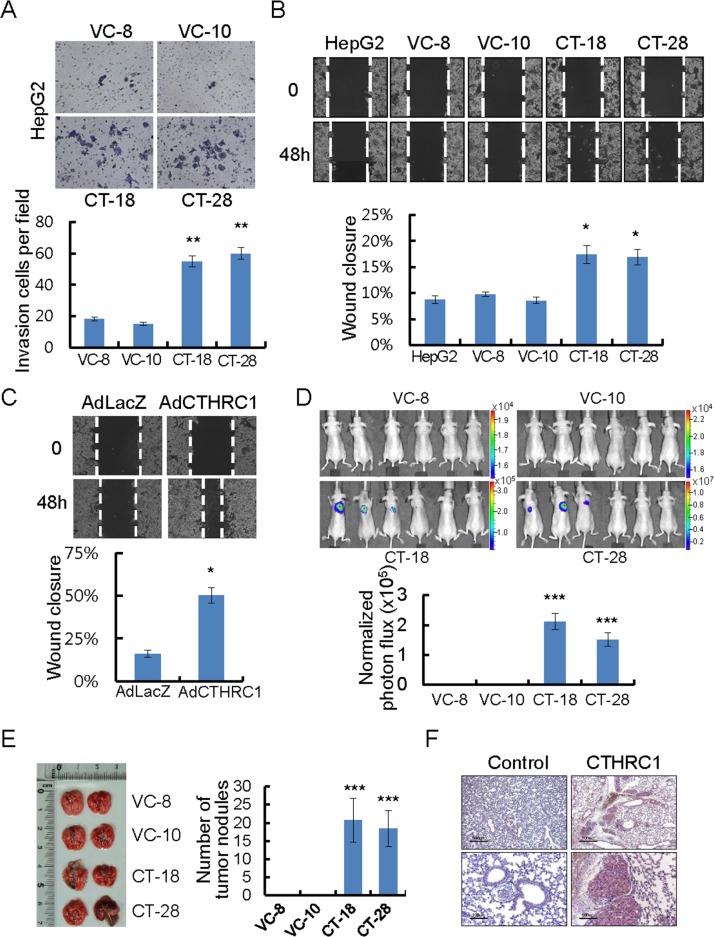
Figure 3. CTHRC1-mediated promotion of invasion and migration in HCC cells.
(A) Photomicrographs of a Matrigel Boyden chamber showing more colonies of CTHRC1-expressed HepG2 cells than vector control cells. HCC cells invaded were normalized to the cell mass on the bottom sides of the membrane (n = 3, mean ± SEM). **P < 0.01. (B) HepG2 cells stably expressing CTHRC1 were then allowed to migrate into the wound area. Quantitative measurements of wound closure ability are shown (n = 3, mean ± SEM). *P < 0.05. (C) The wound closure capacity of HepG2 cells after infection with AdLacZ or AdCTHRC1. Quantitative measurements of wound closure ability are shown (n = 3, mean ± SEM). *P < 0.05. (D) HepG2 stable expressing CTHRC1 cells after infection Adeno-luciferase at 100 MOI 24hr, then 5×10⁵ cells via the tail vein to node mice. Five weeks after tumor implantation, bioluminescent images demonstrated that CTHRC1-expressing tumor cells spread to the both lungs (n = 6), representative anterior-posterior images, 35 s exposure time. Quantities are the measured means of photon flux (lower panel). ***P < 0.001. Color bar (Photons/Sec/cm2, Max/Min); VC-8, 1.96×10⁴/1.51×104; VC-10, 2.31×10⁴/ 1.51×10⁴; CT-18, 3.46×10⁵/1.88×104; CT-28, 1.19×10⁷/6.91×105. (E) Fifty-five days after tumor implantation, mice were euthanized and their lungs evaluated for tumor nodules. Each value is mean ± SEM, ***P < 0.001. (F) Immunohistochemical staining of CTHRC1 in representative tumor tissue samples. CTHRC1 expression in representative tumor tissue samples from mice implanted with cells stably expressing CTHRC1 and with control cells. Scale bars, 500 μm (upper panel) or 100 μm (lower panel).

