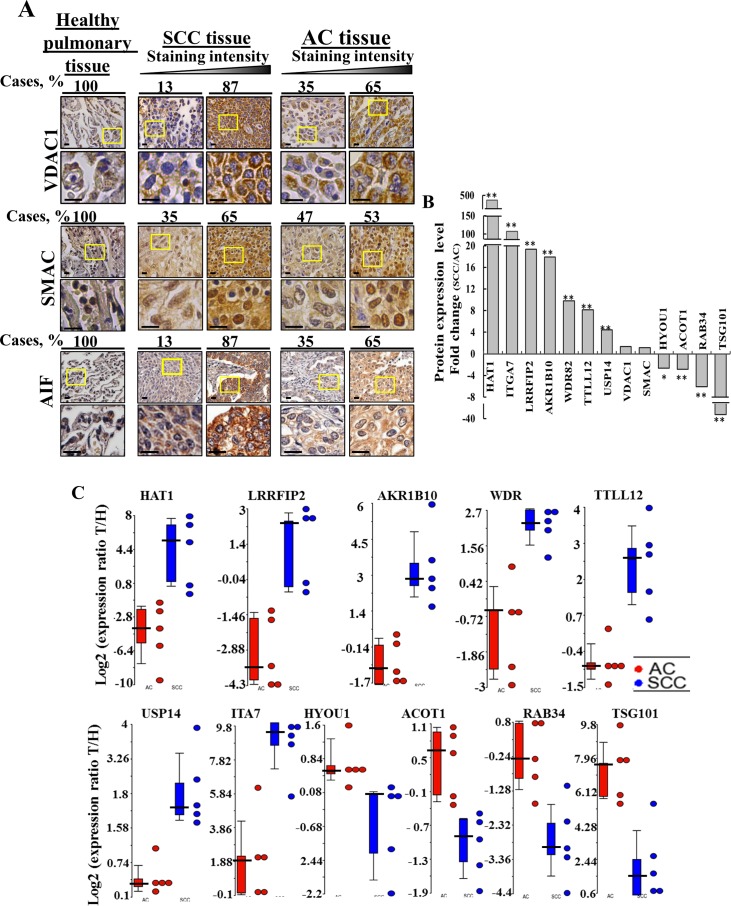
Figure 5. Proteins differentially expressed in AC and SCC.
(A) Tissue array slides (US Biomax) containing human Healthy lung tissue (n=10), lung SCC tissue (n=31) and lung AC tissue (n=21) were stained for VDAC1 and AIF while healthy lung tissue (n=20), lung SCC tissue (n=72) or lung AC tissue (n=72) were stained for SMAC, as described in Supplementary Data. The percentages of patient sample-derived sections stained at the intensity indicated are shown (Cases, %). (B) LC-HR MS/MS data were used to identify proteins that can serve to distinguish between AC and SCC. A difference between AC and SCC groups was considered statistically significant when P< 0.05 (*), P< 0.01 (**) or P < 0.001 (***) as determined by the Mann-Whitney test. (C) Scatter plots display the expression levels (from LC-HR MS/MS data) of TTLL12, AKR1B10, USP14, LRRF2, HAT1, TSG101, WDR, ACOT1 as the log2 ratio of healthy to tumor for AC and SCC after zero intensities were replaced with 1. To eliminate inflated ratios caused by division by 1, log2 ratios larger than 10 (∼1000 fold in linear scale) were replaced by 10. For each protein, a t-test was carried out between the log2 ratios of the SCC patients and the log2 ratios of the AC patients. A total of 10 proteins had nominal p-value < 0.01. No protein had FDR adjusted p-value < 0.1. Statistics were calculated with GraphPad Prism software. Horizontal lines represent mean values for each group.

