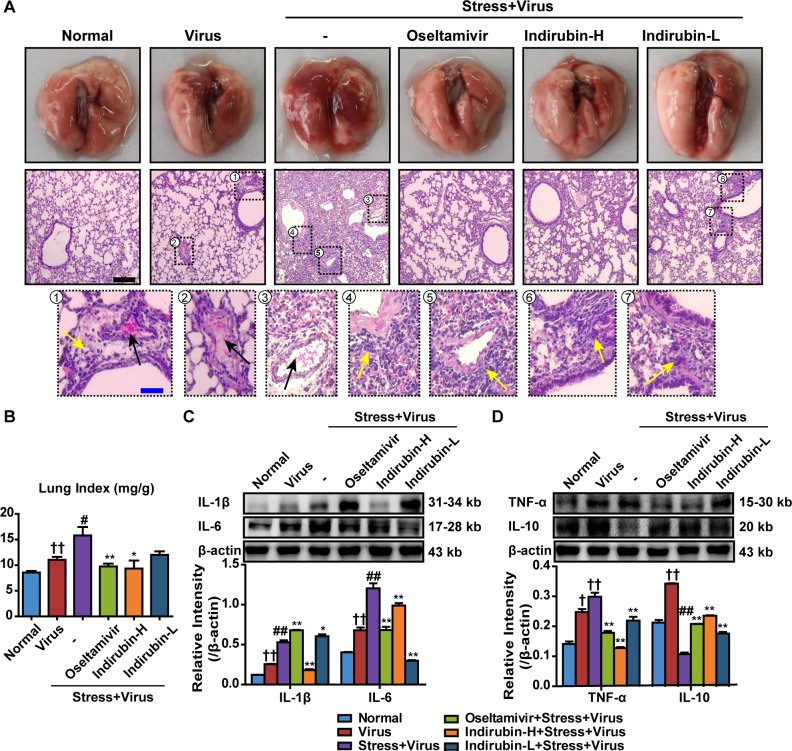
Figure 2. Indirubin protects against pneumonia caused by influenza infection in stressed mice.
(A) Histologic sections of lung tissues on the 5th day after influenza virus challenge, stained by H&E to exam histopathologic changes (Black scale bar = 100 μm, Blue scale bar = 25 μm). Black arrows represent congesting vessels and yellow arrows stand for inflammatory cells infiltration. (B) Effects of indirubin administrations on the lung index in H1N1-infected restraint-stressed mice. The protein expressions of IL-1β, IL-6 (C), TNF-α and IL-10 (D) in the lung tissues. “-” indicates no treatment. Indirubin-H and Indirubin-L respectively represent the higher dose of indirubin (5 mg·kg−1·d−1) and the lower dose of indirubin (2.5 mg·kg−1·d−1). The difference was considered statistically significant at †P < 0.05, ††P < 0.01 vs. Normal group; #P < 0.05, ##P < 0.01 vs. Virus group; *P < 0.05, **P < 0.01 vs. “Stress+Virus” group. Data are expressed as mean ± SEM from 3 independent determinations.

