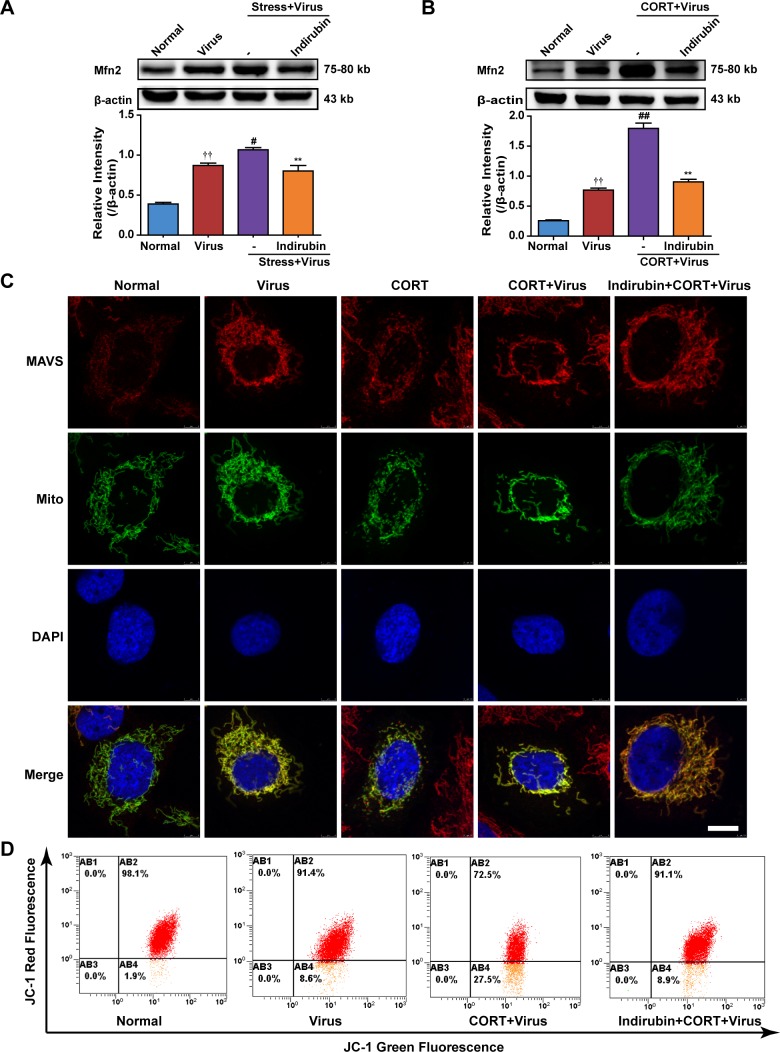
Figure 6. The maintenance of mitochondrial morphology contributes to the effect of indirubin on MAVS signaling.
Expression of Mfn2 in restraint-stressed mice (A) and CORT-loaded A549 cells (B). The difference was considered statistically significant at ††P < 0.01 vs. Normal group; #P < 0.05, ##P < 0.01 vs. Virus group; **P < 0.01 vs. “Stress+Virus” or “CORT+Virus” group. “-” indicates no treatment. Data are expressed as mean ± SEM from 3 independent determinations. The morphology of mitochondria and the location of MAVS in A549 cells were observed by the transfection of pAcGFP1-Mito Vector and the immunofluorescence of MAVS (C) (MAVS: red, Mitochondria: green, DAPI nuclear stain: blue, scale = 5 μm). Mitochondrial membrane potential in A549 cells was determined by flow cytometry using JC-1 staining (D).

