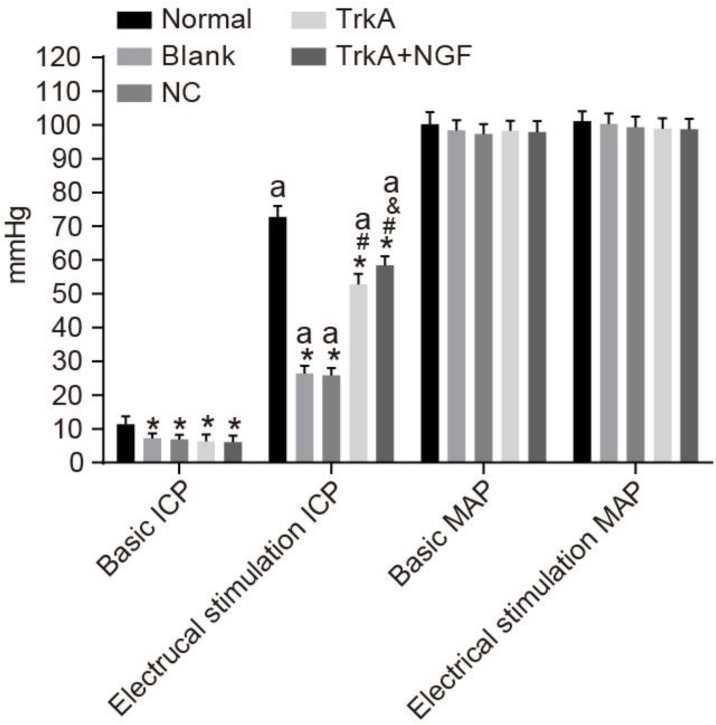
Figure 2. Comparisons of ICP and MAP of rats.
Compared with the normal group (the basic ICP [11.37 ± 2.41 mmHg]), the basic ICP of the blank, NC, TrkA and TrkA + NGF groups were decreased (P < 0.05). After electrical stimulation, MPG and ICP were increased in the normal group. In all groups, the ICP values after electrical stimulation and the basic ICP values were significantly different (P < 0.05). No significant difference was seen in the ICP values after electrical stimulation between the blank and the NC groups (P > 0.05). Compared with the blank and the NC groups, the ICP values after electrical stimulation were increased in the TrkA and the TrkA + NGF groups. When compared with the TrkA group, the ICP values after electrical stimulation were increased in the TrkA + NGF group (all P < 0.05). No significant difference of the basic MAP values was found among the groups (all P > 0.05). Note: ICP: intracavernous pressure; MAP: mean arterial pressure. *P < 0.05, compared with the normal group;#P < 0.05, compared with the blank group; &P < 0.05, compared with the TrkA group; aP < 0.05, compared with the pre-electrical stimulation.

