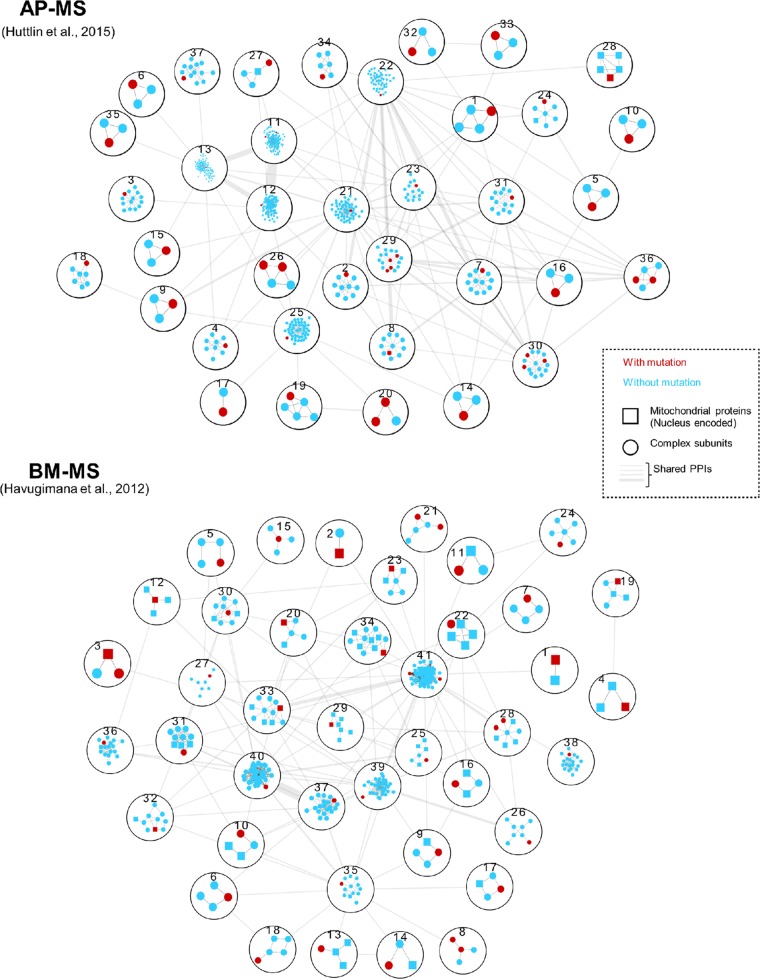
Figure 1. Genes with renal oncocytoma somatic mutations were mapped to previously published protein complexes identified by two biochemical techniques: AP-MS (Affinity-Purification Mass Spectrometry) [24] and BM-MS (Bio Macromolecular-Mass Spectrometry) [22].
Protein complexes with non-silent mutations, including missense and frame-shift mutations were numbered and described in Supplementary Table 5. Within each complex, genes with renal oncocytoma somatic mutations were denoted in red, and nucleus encoded mitochondrial proteins were marked with squares. The thickness of edges between protein complexes indicate number of inter protein complex PPIs.

