
Figure 4. Comparison of the risk values based on AIEOP LH-2004 group therapy protocol and HLA-G +3027 algorithm.
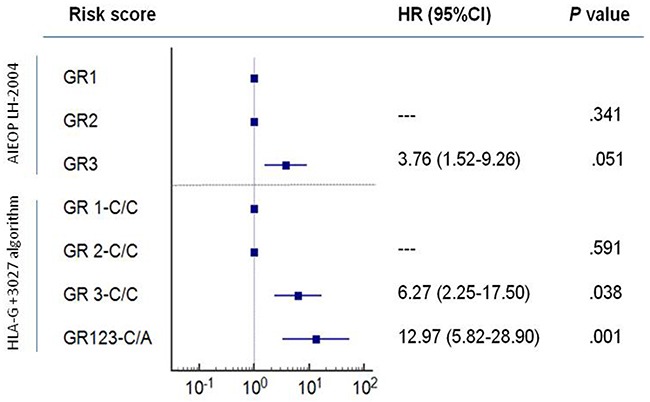
Kaplan-Meier survival analysis show hazard ratios (HR) for GR1, GR2 and GR3 groups based on AIEOP LH-2004 therapy and the HLA-G genetic groups, GR1,2,3-C/C and GR123-C/A based on our analysis. Note: GR1 and GR 1-C/C as reference categories; 95% CI confidence intervals are shown for event-free survival (EFS).