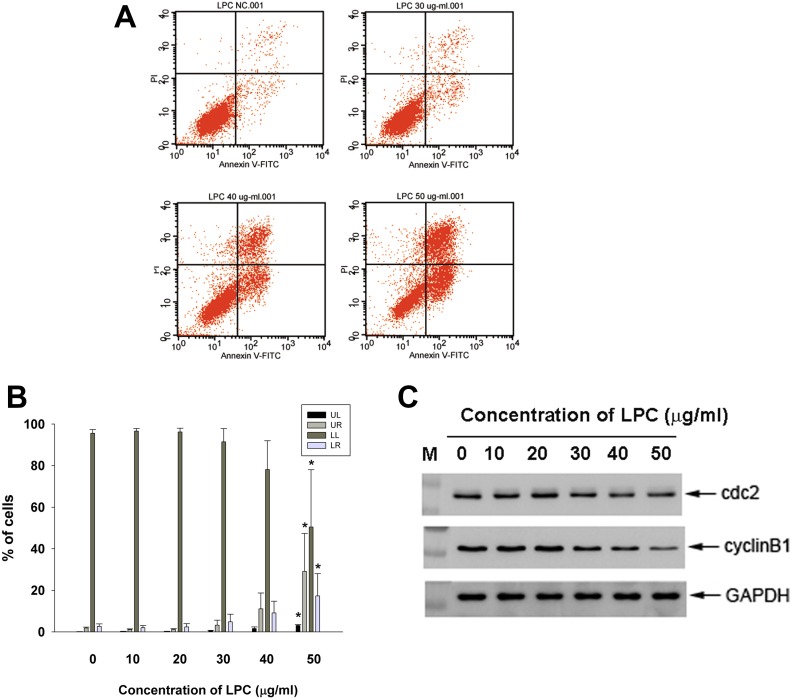
Figure 3. Effect of LPC on apoptosis of EAHY endothelial cells as analyzed by PI and annexin V dual fluorescent flow cytometry.
(A) One representative flow cytometry picture was shown. (B) Quantitative analysis of PI + annexin V flow cytometric analysis. *denotes statistically significant difference (p < 0.05) when compared with control (C) Effect of LPC on cdc2, and cyclin B1 protein expression of EAHY cells. One representative western blot picture was shown. Expression of GAPDH was used as control.

