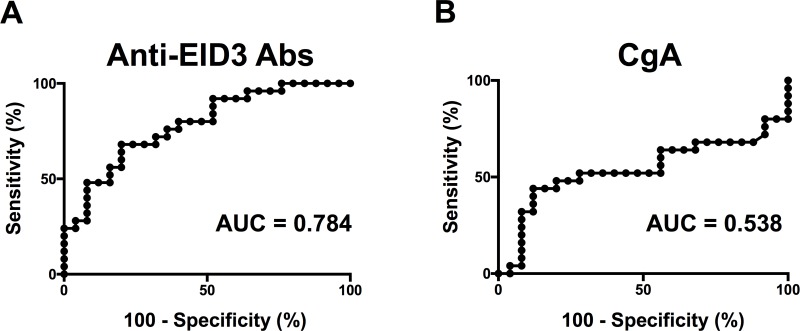
Figure 4. Diagnostic accuracy of Anti-EID3 Abs and CgA in NF-pNETs.
In order to evaluate the diagnostic potential of serum anti-EID 3 Ab and CgA in the detecting NF-pNET, ROC curve analysis was performed. (A) ROC curve analysis of serum anti-EID3 Ab levels in diagnosing NF-pNET patients. The AUC calculated from the results of the ROC curve analysis was 0.784 (95% CI: 0.658–0.909). (B) ROC curve analysis of serum Chromogranin A in diagnosing NF-pNET patients. The AUC calculated from the results of the ROC curve analysis was 0.538 (95% CI: 0.367–0.709). ROC: receiver operating characteristic, AUC: area under curve, NF-pNETs: non-functional pancreas neuroendocrine tumors.

