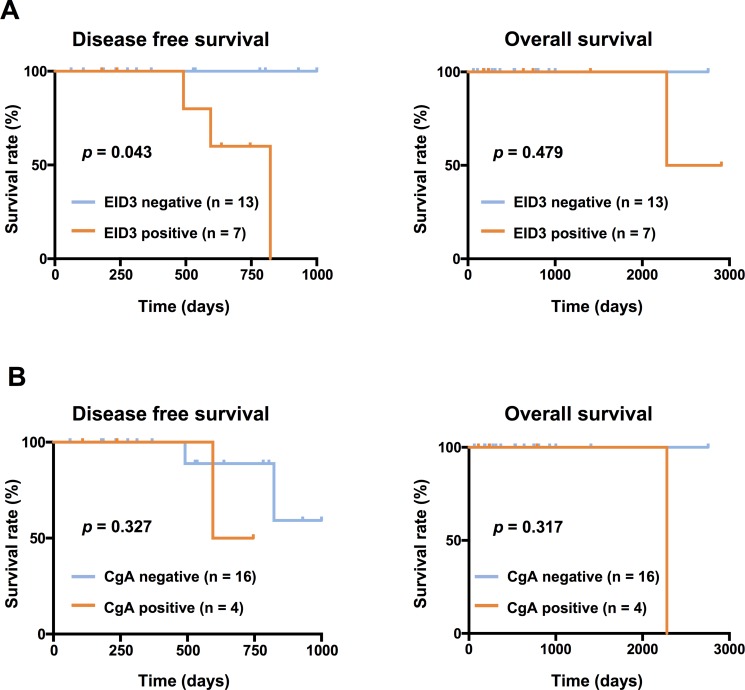
Figure 5. Kaplan-Meier survival curves depicting DFS and OS according to the level of serum anti-EID3 Ab and CgA levels.
The Kaplan-Meier plots show the relationship between serum anti-EID3 Ab and CgA levels and prognosis. The patient group was divided into two groups according to the cut-off value of serum anti-EID3 Ab levels set as the mean + two SDs of the HD group (EID3 Ab-positive: serum anti-EID3 Ab levels ≥ cut-off value, EID3 Ab-negative: serum anti-EID3 Ab levels < cut-off value). Patients who were serum anti-EID3 Ab-positive had a significantly shorter DFS than those who were Ab-negative (Log rank test, p = 0.0436). There was no significant correlation between serum anti-EID3 Ab level and OS. Similarly, the patient group was divided into two groups (CgA-positive: serum CgA levels ≥ cut-off value, CgA-negative: serum CgA levels < cut-off value, cut-off value: 17.61 pmol/mL). There was no significant difference between serum CgA levels and OS or DFS. DFS: disease free survival, OS: Overall survival, NF-pNETs: non-functional pancreas neuroendocrine tumors.

