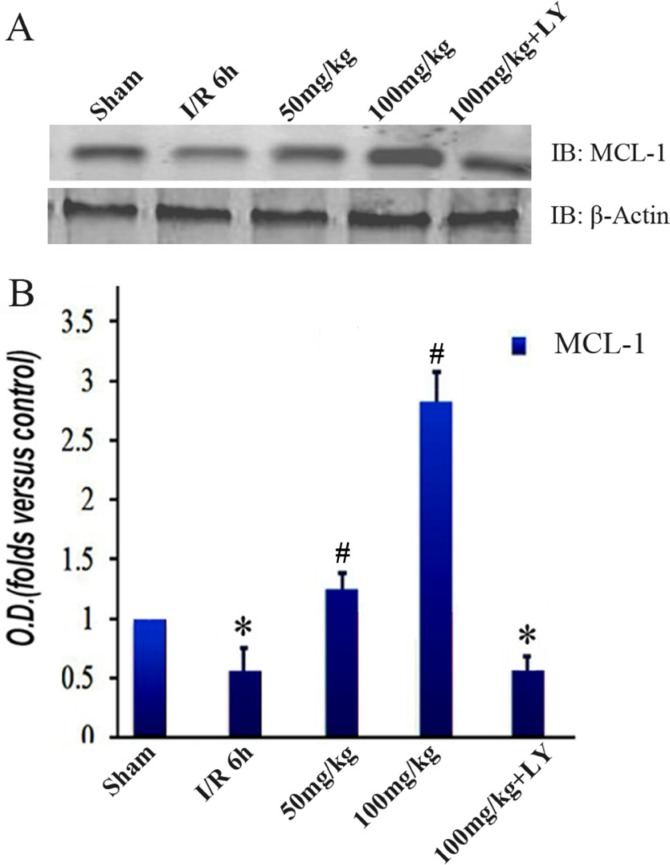
Figure 7. Puerarin increased MCL-1 in the hippocampus after I/R-induced injury.
(A) Immunoblot bands were scanned. (B) The intensity of the bands was expressed by optical density (O.D.) analysis. Data are presented as the mean ± SD and analyzed by one-way ANOVA followed by the Newman–Keuls test. *p < 0.05, relative to the sham group. #p < 0.05, relative to the I/R group.

