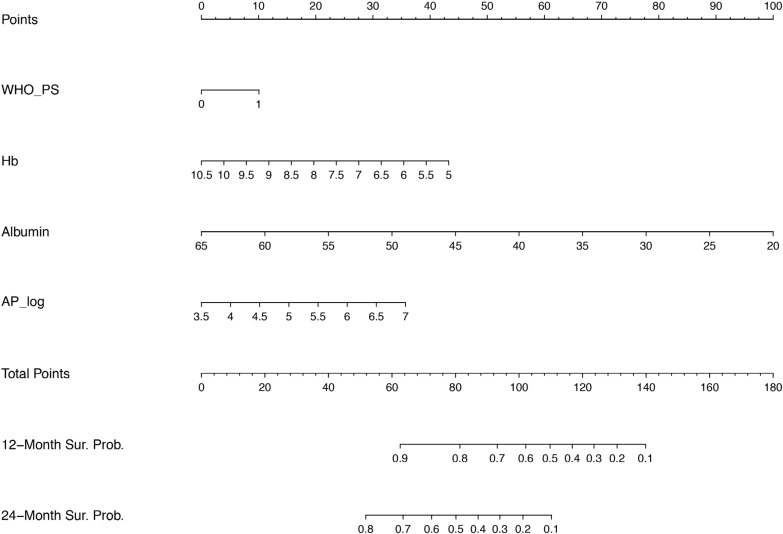
Figure 1. Nomogram for OS.
Prognostic nomogram predicting overall survival probability. For each variable, starting with WHO performance score on the second axis, draw a vertical line up to the ‘Points’ axis (top line) to identify the number of prognostic points the patient receives for the value of this variable. Calculate the ‘Total Points’ by adding up the prognostic points for each variable. Determine the 12 month or 24 month overall survival by drawing a vertical line from the ‘Total Points’ axis down to the axis indicating the survival probabilty. WHO PS = world health organization performance status, Hb = hemoglobin, AP = alkaline phosphatase, log = log transformed variables when data were not normally distributed.

