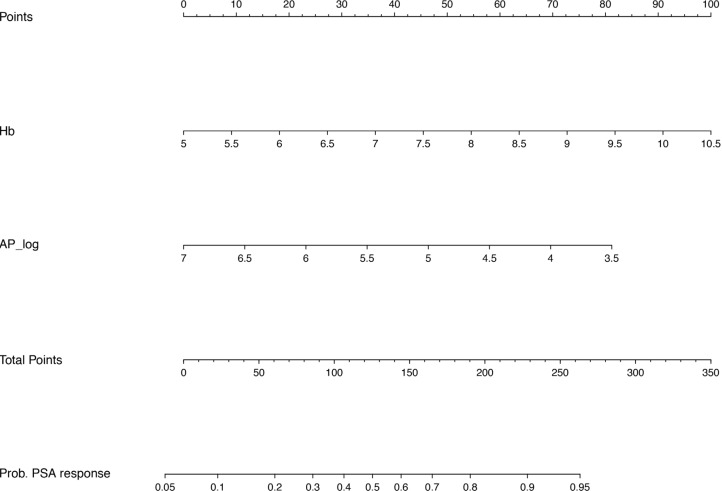
Figure 2. Nomogram for PSA response.
Prognostic nomogram predicting PSA response. For both variables, Hb and AP_log, draw a vertical line from the absolute value of this variable up to the ‘Points’ axis (top line) to identify the number of prognostic points the patient receives for these variables. Calculate the ‘Total Points’ by adding up the prognostic points for both variables. Determine the probability of PSA response by drawing a vertival line form the ‘Total Points’ axis down to the axis of the probability of PSA response. Hb = hemoglobin, AP = alkaline phosphatase, log = log transformed variables when data were not normally distributed.

