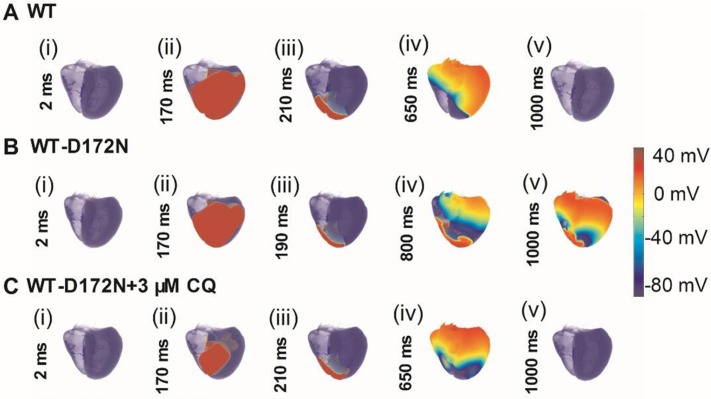
Figure 11. Snapshots of initiation and conduction of re-entry in the 3D model of human ventricles.
(A) A conditioning wave generated by an S1 stimulus. Scroll wave was initiated by using the cut-wavefront protocol after a delay of 210 ms for the WT condition from the initial wave stimulus. Snapshots at time = 2 ms (i), 170 ms (ii), 210 ms (iii), 650 ms (iv), and 1000 ms (v). (B) Scroll wave was initiated by using the cut-wavefront protocol after a delay of 190 ms for WT condition from the initial wave stimulus. Snapshots at time = 2 ms (i), 170 ms (ii), 190 ms (iii), 800 ms (iv), and 1000 ms (v). (C) Scroll wave was initiated by using the cut-wavefront protocol after a delay of 210 ms for the WT condition from the initial wave stimulus. Snapshots at time = 2 ms (i), 170 ms (ii), 210 ms (iii), 650 ms (iv), and 1000 ms (v). Scroll wave self-terminated in the WT condition before this recording point, but persisted in the WT-D172N condition. CQ terminated the scroll wave.

