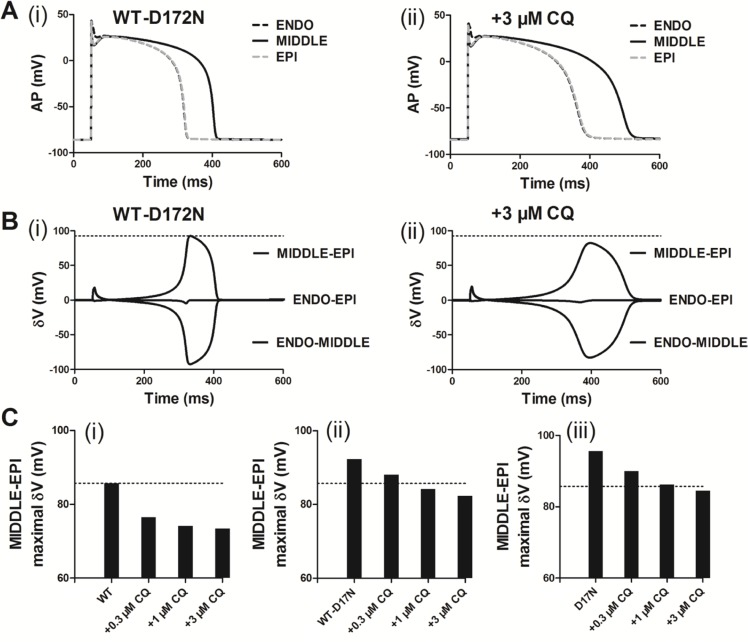
Figure 6. Membrane voltage heterogeneity (δV) between ENDO, MIDDLE, and EPI cells and transmural APD90 distribution and its spatial gradient in the 1D transmural strand.
(A) ENDO, MIDDLE, and EPI APs for the WT-D172N simulations (i) at 3 µM concentration of CQ (ii). (B) Plots of δV against time for the WT-D172N simulations (i) at 3 µM concentration of CQ (ii). (C) Maximal δV observed during repolarization (MIDDLE-EPI) for the WT (i), WT-D172N (ii) and D172N (iii) simulations at the indicated CQ concentrations.

