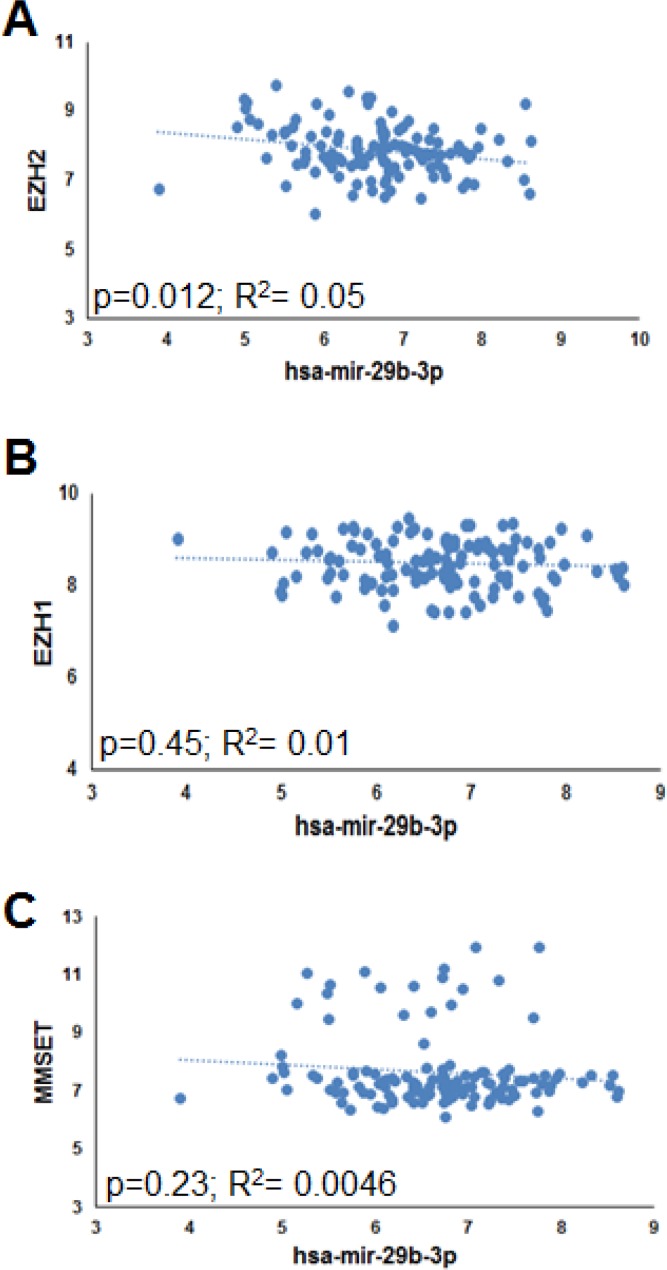
Figure 1. Inverse correlation between EZH2 and miR-29b in MM patient-derived plasma cells.
Correlation of endogenous miR-29b levels with EZH2 (A), EZH1 (B) and MMSET (C) mRNA levels, determined by high density microarray analysis of mRNA or miRNA expression in GSE73454 (for miR-29b) and GSE73452 (for EZH2 mRNA) datasets. Log values of raw data are reported in graph. R = regression coefficient.

